Reporting on marketing attribution is essential, but notoriously difficult.
The customer journey, especially in B2B, has multiple touchpoints that take place over an extended period. This makes it difficult to prove the ROI on campaigns and measure how specific channels and campaigns impact business-critical metrics like customer lifetime value.
To solve this puzzle, you need to do five things:
Unify your data and maintain data hygiene
Use UTM parameters to track activity
Identify the best marketing attribution model or models for your business
Build your attribution reports
Identify data gaps and reporting needs and continue to iterate
In this article, we'll briefly look at the most common marketing attribution models and share four marketing attribution report templates.
Marketing attributionmodels
Attribution models assign a specific amount of ‘credit’ to different touch points across the customer journey, allowing you to better understand the role each campaign and channel plays in conversions.
The five most common marketing attribution models are:
Last-touch attribution: In this model, all the credit is given to the very last touch point before conversion. This model is easy to track and accurate, but it fails to recognize the impact of other touch points in the buying cycle.
First-touch attribution: In this model, the first touch point is given 100% of the credit. This model is great for understanding brand awareness and how leads enter the sales funnel, but it has limitations when used independently.
Linear attribution: In this model, each touch point that leads to conversion is given an even weighting, as long it occurs within the attribution window (in Ortto, the default attribution window is set to six days). This model provides a balanced view of channels across the customer journey.
Time-decay attribution: In this model, campaigns and channels are credited according to when the touch points occurred, with the touch points closer to conversion receiving a greater weighting. This model is effective for long sales cycles.
Position-based attribution (aka U-shaped attribution): In this model, credit is given based on the point of conversion. First and last touch are given more credit and the remaining credit is distributed between the remaining touch points. This model affords the most credit to the most important touch points (first and last), but ensures the other touch points are not ignored.
Attribution is measured best when different models are used together to help you understand the role campaigns and channels play across the entire customer lifecycle. That said, it can be beneficial to choose one primary attribution model to work with as a default for consistency's sake and for ease of reporting in your martech tools.
For more information on marketing attribution models, how to choose and set up the right one for your goals, read this blog.
4 marketing attribution reporting templates
One of the biggest hurdles to accurately reporting on attribution is building complicated reports. We've made it easy for you with four free marketing attribution reporting templates that help you get a clearer picture of the channels and campaigns that positively impact key business metrics.
1. Attributed revenue by campaign report
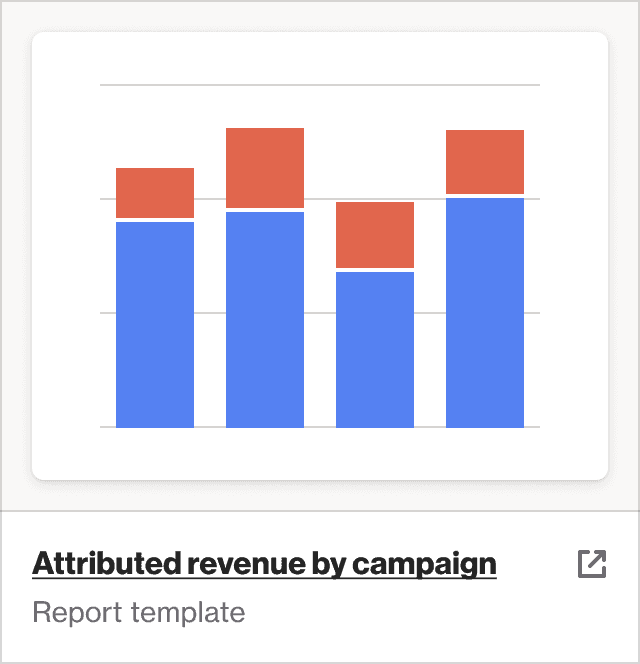
The attributed revenue by campaign report template allows you to see the total attributed revenue on a particular campaign to help you understand which drives the most revenue. This is useful for reporting on the effectiveness of paid campaigns like paid search/ads and sponsored content.
The attribution model type is determined by you. Simply navigate to Setup then Attribution, and then select the attribution to display your chosen metrics (e.g. MRR or ARR).
2. Attributed revenue by campaign (pie chart)
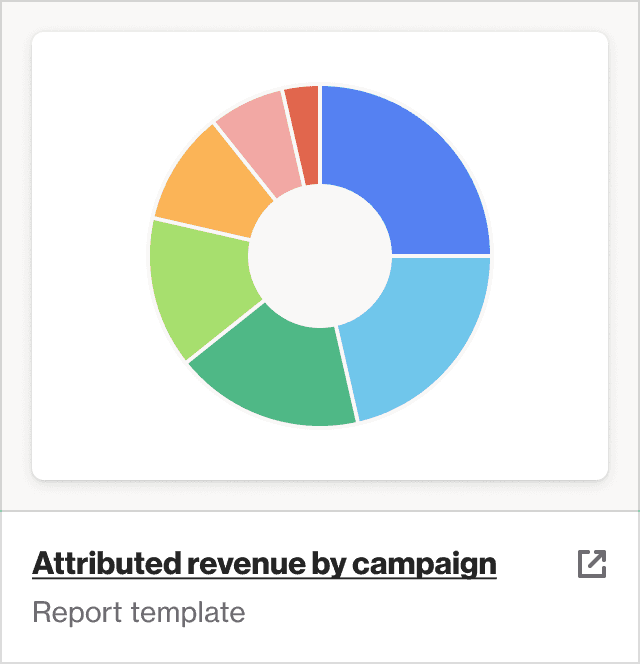
The attributed revenue by campaign pie chart template shows attributed revenue based on your attribution model by campaign for the given time period. With this template, you can easily visualize, at a glance, which campaigns contribute the most revenue. This is useful when comparing campaign output vs. input.
3. Total attributed revenue
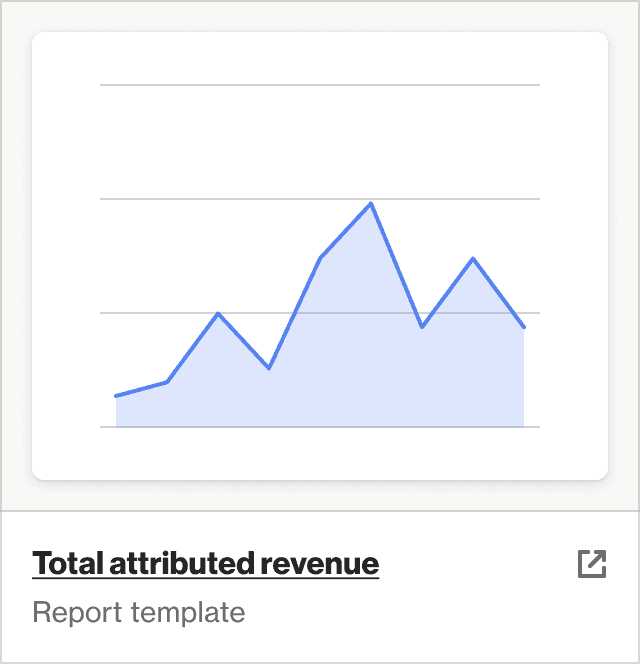
The total attributed revenue template shows the total attributed revenue over a given time period. The attributed revenue is shown cumulatively with a comparison to the previous time period. This is useful for looking back over a monthly/quarterly/bi-annual/annual basis. The attributed revenue is based on the model you set up.
4. Total attributed revenue metric
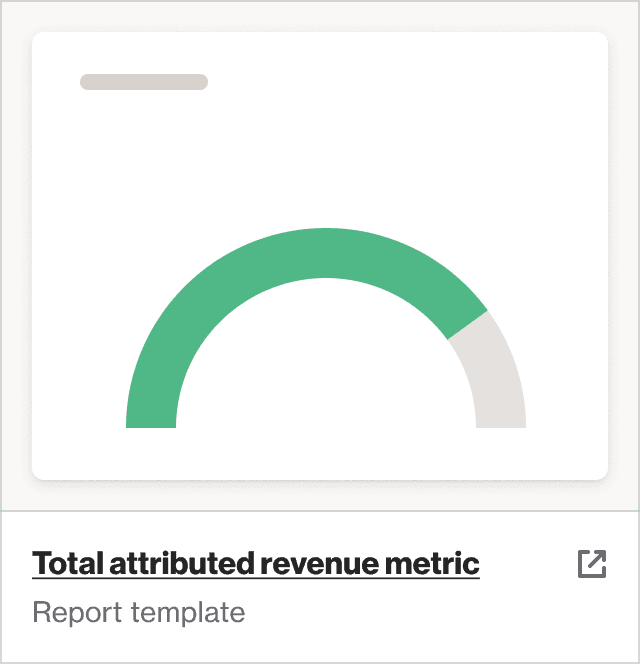
The total attributed revenue metric template shows the total attributed revenue from all campaigns for a given period. You can set a target goal to monitor your progress and embed it on your marketing dashboard to quickly refer to again and again. You can control revenue attribution settings in Setup.
Final word
Measuring marketing attribution is essential for every marketer — especially those working with restricted budgets where every dollar needs to count. Our marketing attribution templates are designed to take the heavy lifting out of your attribution reporting and give you a starting point on which you can iterate to get a clearer picture of what's working and why.
Author

More by Ellie Wiseman
Ellie Wiseman has no more articles

