

MARKETING ANALYTICS
Understand what’s working, and why
Know how campaigns are impacting key marketing metrics and spot trends in your customer data – then take action in connected automation tools.
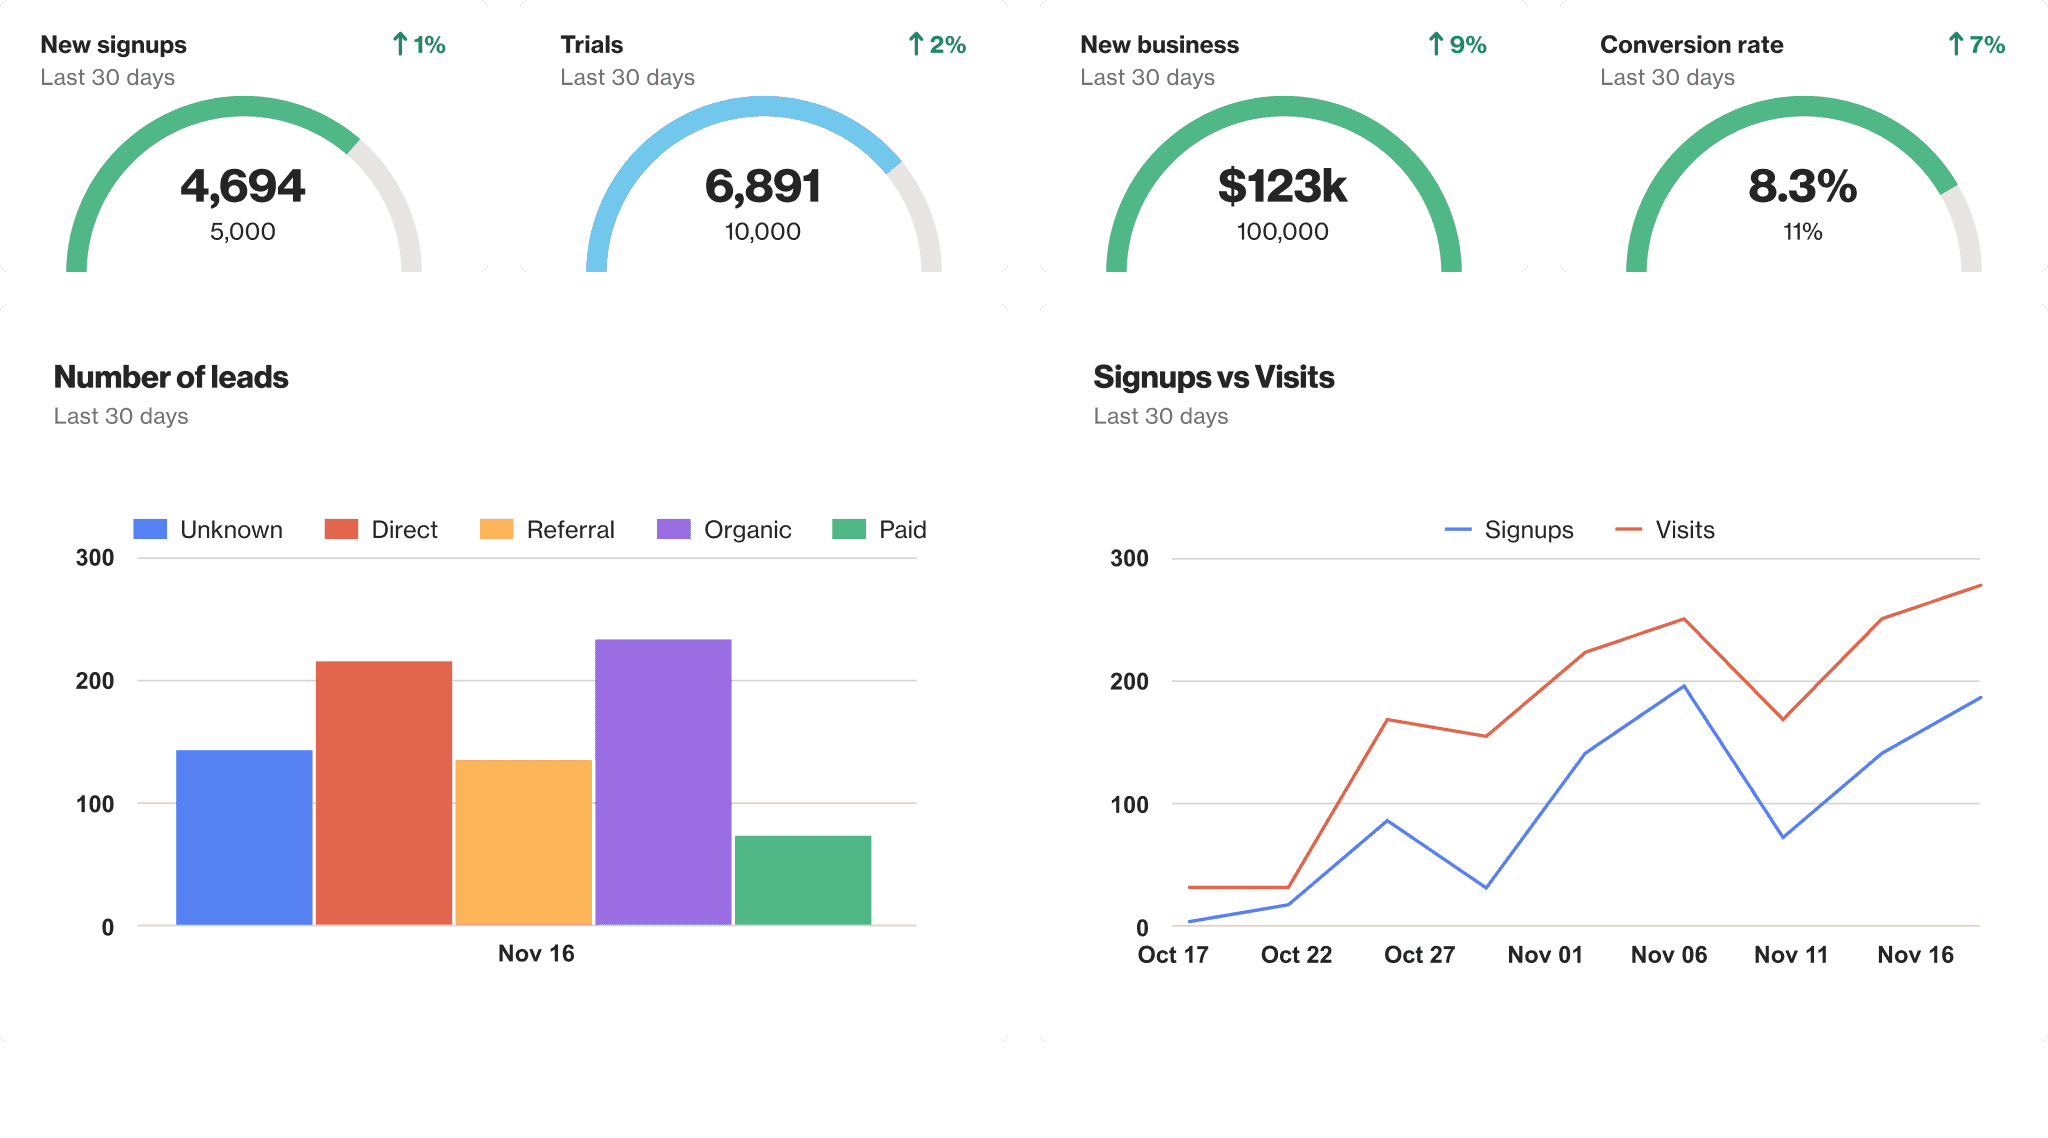


Built-in reports
Get marketing automation insights at a glance
Ship a campaign or capture widget then see how they perform with out-of-the box reports, available automatically with our marketing analytics solutions.
Built-in reports
Get marketing automation insights at a glance
Ship a campaign or capture widget then see how they perform with out-of-the box reports, available automatically with our marketing analytics solutions.
Built-in reports
Get marketing automation insights at a glance
Ship a campaign or capture widget then see how they perform with out-of-the box reports, available automatically with our marketing analytics solutions.







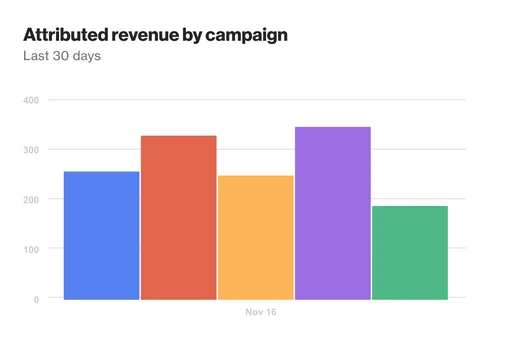


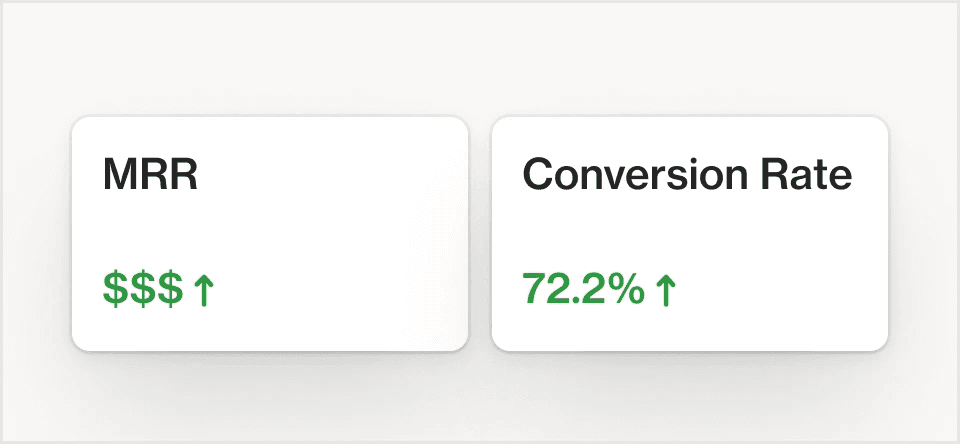
Campaign attribution
Deliver messages at the right time based on a predefined amount of time, a specific date, or a dynamic date.
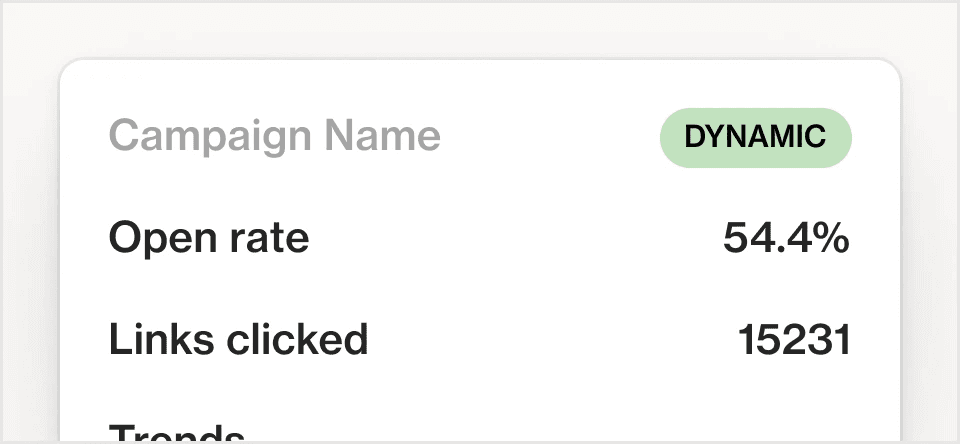
Engagement metrics
Visualize engagement with campaigns and widgets in real-time, including open rates, links clicked, and regional trends.
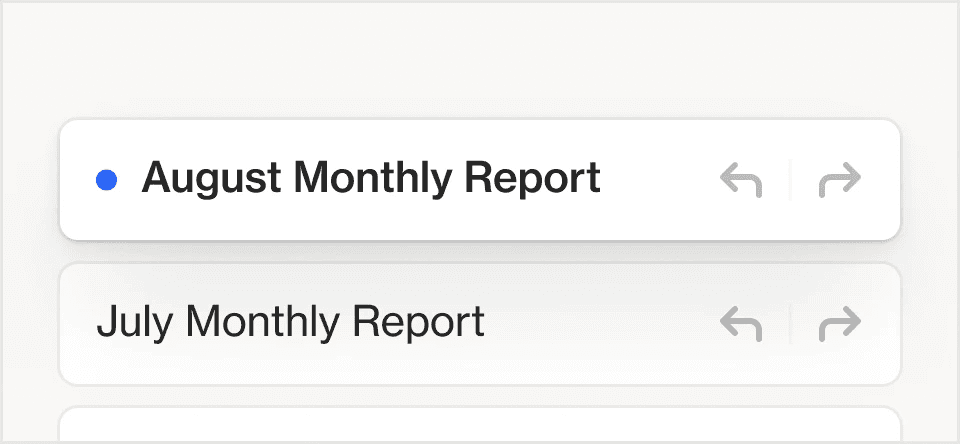
Set up notifications
Keep up-to-date with reports delivered straight to your inbox at a frequency you set.

Campaign attribution
Deliver messages at the right time based on a predefined amount of time, a specific date, or a dynamic date.

Engagement metrics
Visualize engagement with campaigns and widgets in real-time, including open rates, links clicked, and regional trends.

Set up notifications
Keep up-to-date with reports delivered straight to your inbox at a frequency you set.

Campaign attribution
Deliver messages at the right time based on a predefined amount of time, a specific date, or a dynamic date.

Engagement metrics
Visualize engagement with campaigns and widgets in real-time, including open rates, links clicked, and regional trends.

Set up notifications
Keep up-to-date with reports delivered straight to your inbox at a frequency you set.
Custom reports
Answer more complex questions, easily
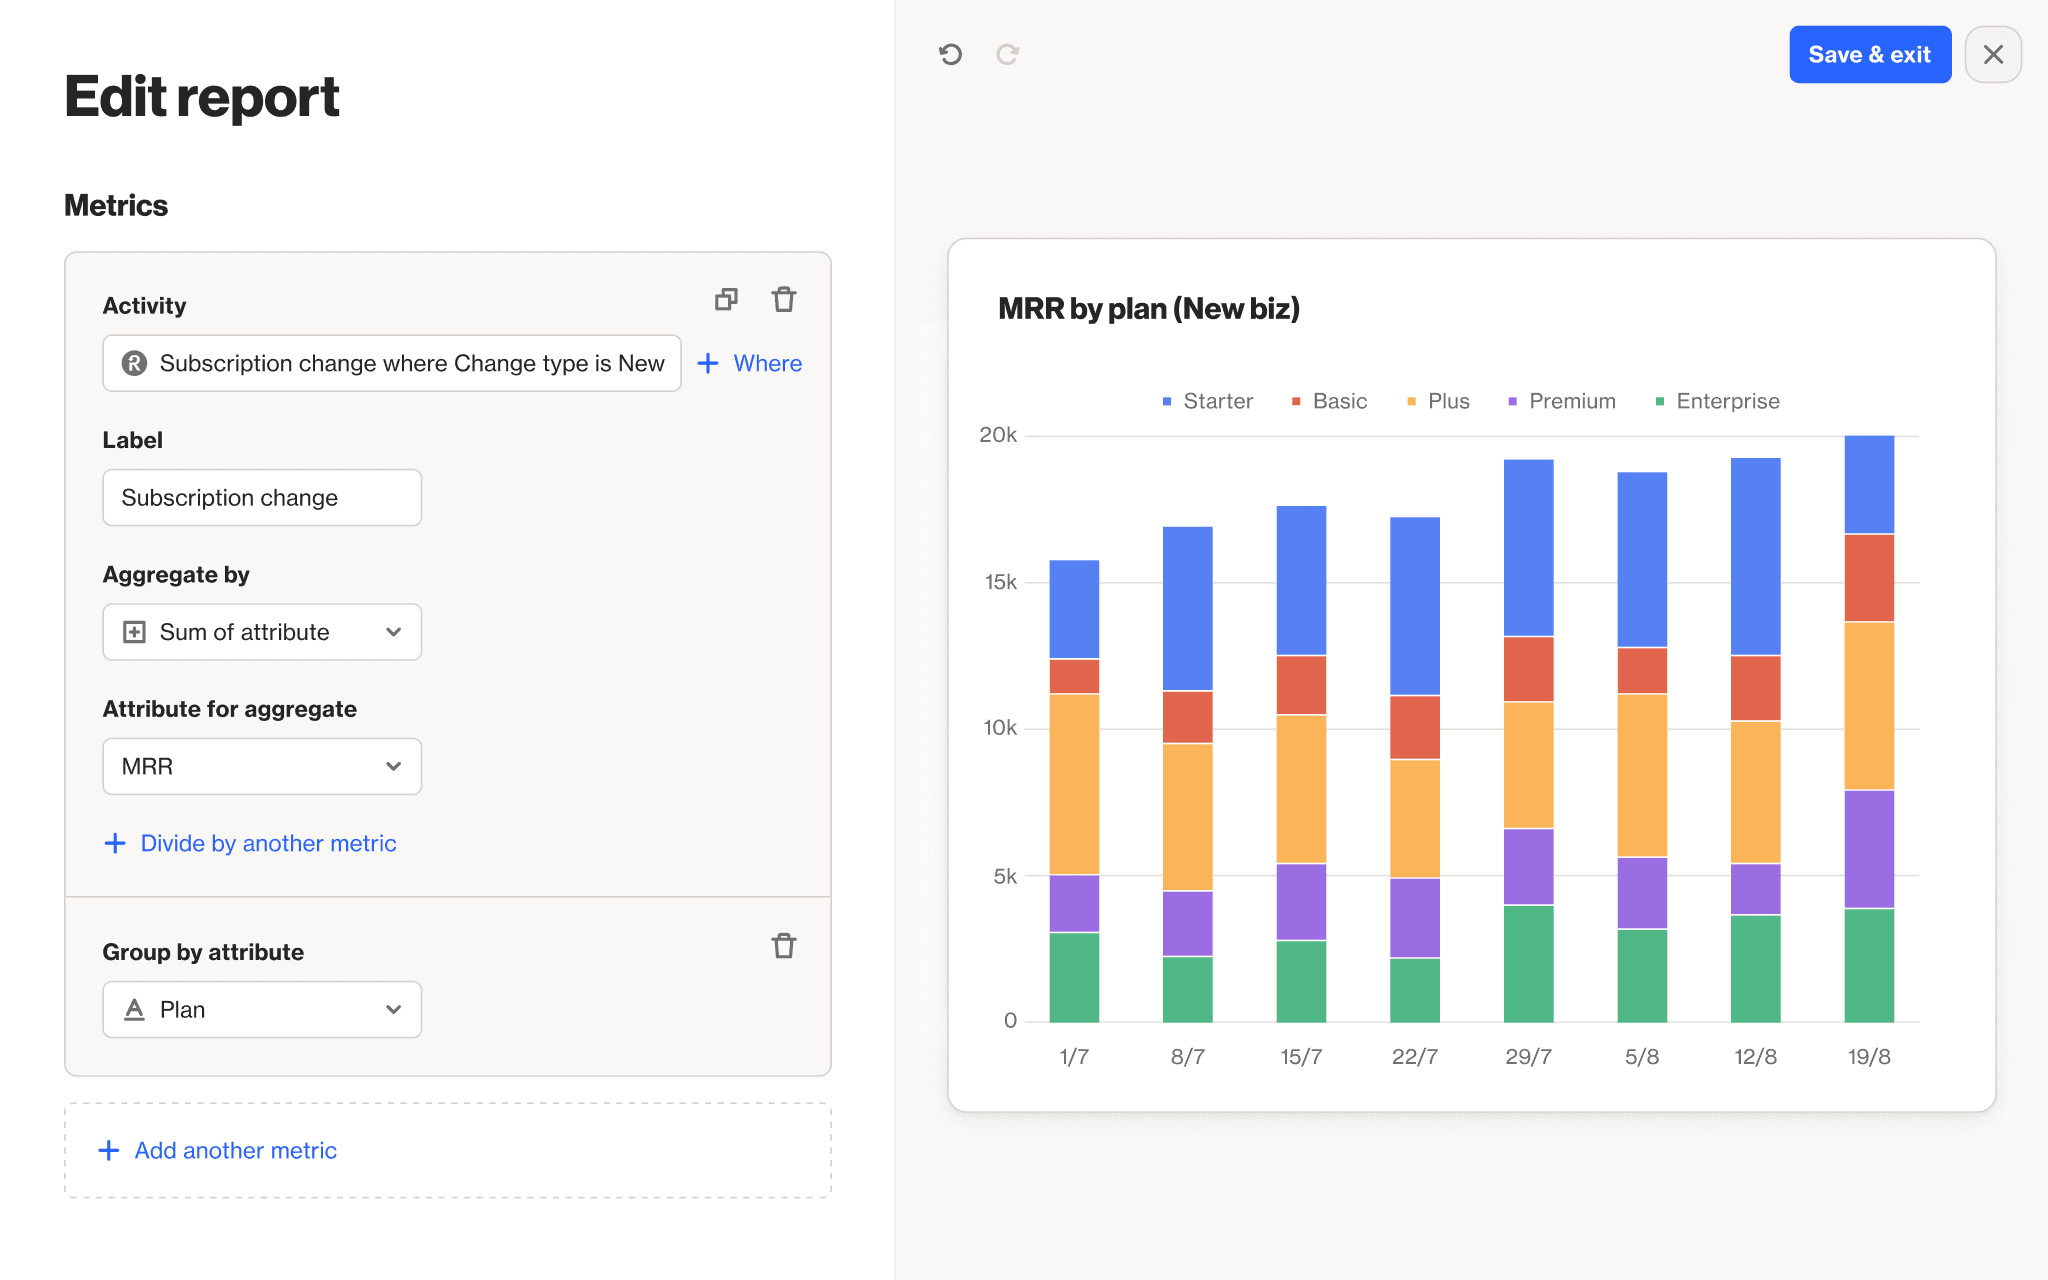
Empower your whole team to discover insights and see how their work impacts key metrics with intuitive marketing analytics tools.
Custom reports
Answer more complex questions, easily
Empower your whole team to discover insights and see how their work impacts key metrics with intuitive marketing analytics tools.
Custom reports
Answer more complex questions, easily
Empower your whole team to discover insights and see how their work impacts key metrics with intuitive marketing analytics tools.


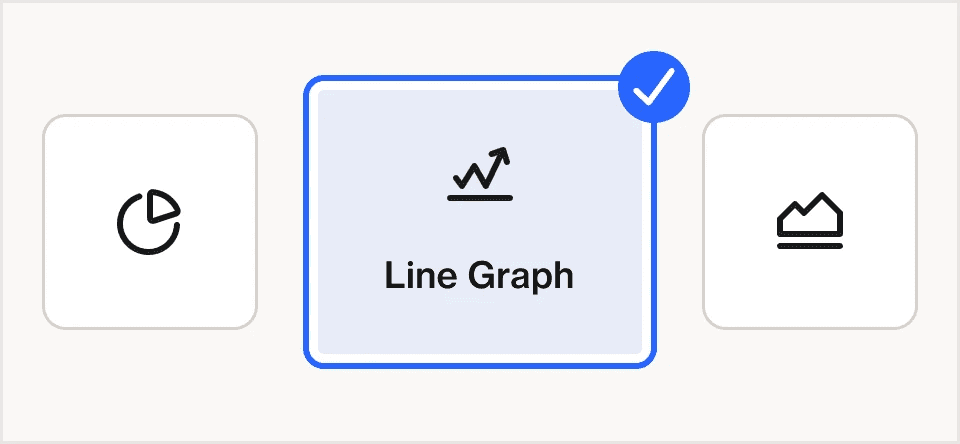
10 visualization options
See your data in a variety of report options including: column, pie chart, funnels, cohorts and more.
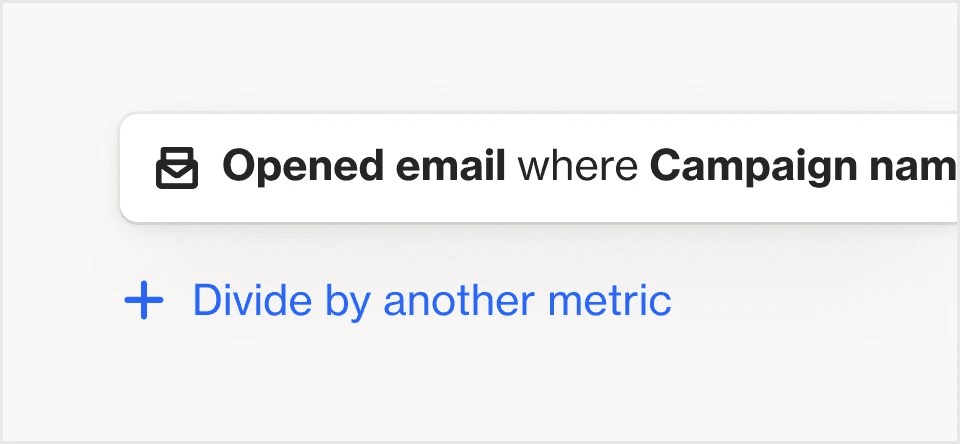
Breakdown data attributes
Use aggregates to break down data for a more granular view.
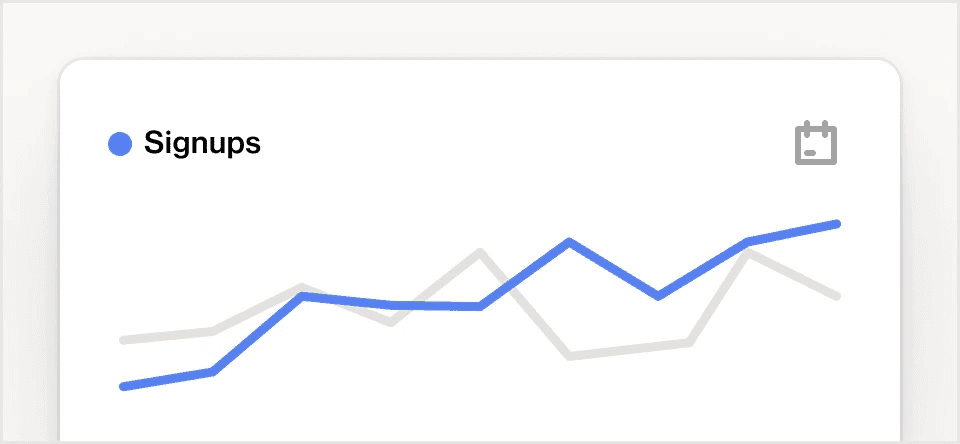
Signups vs signups from last period
Compare performance to previous periods to spot trends.

10 visualization options
See your data in a variety of report options including: column, pie chart, funnels, cohorts and more.

Breakdown data attributes
Use aggregates to break down data for a more granular view.

Signups vs signups from last period
Compare performance to previous periods to spot trends.

10 visualization options
See your data in a variety of report options including: column, pie chart, funnels, cohorts and more.

Breakdown data attributes
Use aggregates to break down data for a more granular view.

Signups vs signups from last period
Compare performance to previous periods to spot trends.
Dashboards
Align your team with custom dashboards
Ensure everyone stays focused on what matters with reports that track performance toward a set goal and quick-create dashboards.
Dashboards
Align your team with custom dashboards
Ensure everyone stays focused on what matters with reports that track performance toward a set goal and quick-create dashboards.
Dashboards
Align your team with custom dashboards
Ensure everyone stays focused on what matters with reports that track performance toward a set goal and quick-create dashboards.
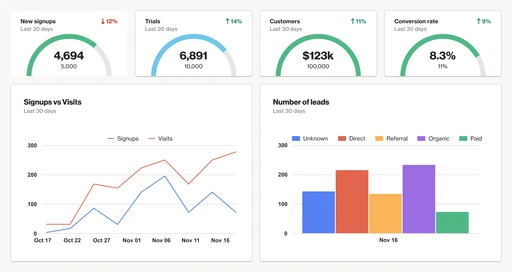





Set goals
Create a metric report with a defined goal and see how pacing compares over time.
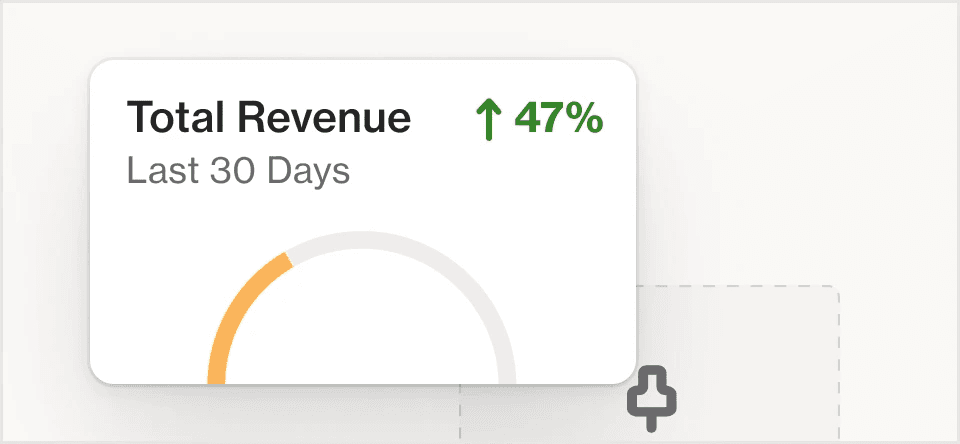
Pin reports to dashboards
Quickly add reports and organize them to create custom dashboards.

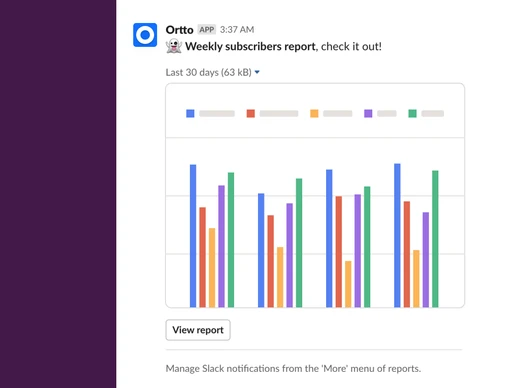
Surface reports & dashboards
Deliver them directly to your team’s inbox, display metrics on screens, and set up Slack notifications.

Set goals
Create a metric report with a defined goal and see how pacing compares over time.

Pin reports to dashboards
Quickly add reports and organize them to create custom dashboards.

Surface reports & dashboards
Deliver them directly to your team’s inbox, display metrics on screens, and set up Slack notifications.

Set goals
Create a metric report with a defined goal and see how pacing compares over time.

Pin reports to dashboards
Quickly add reports and organize them to create custom dashboards.

Surface reports & dashboards
Deliver them directly to your team’s inbox, display metrics on screens, and set up Slack notifications.
INTEGRATIONS
Analyze all your customer data with one-click integrations


Templates
Ask more data questions.
Inspire your next marketing idea
Ask more data questions. Inspire your next marketing idea
Campaign-level metrics are just the start. With Ortto’s consolidated platform, you get better marketing automation analytics so you can discover more opportunities to influence growth.
Engagement reports
See campaign-level metrics and benchmark them against your other campaigns. Monitor how engagement trends over time
Campaign attribution
Understand how your automations are influencing revenue. Use breakdowns to spot the strongest or weakest performers.
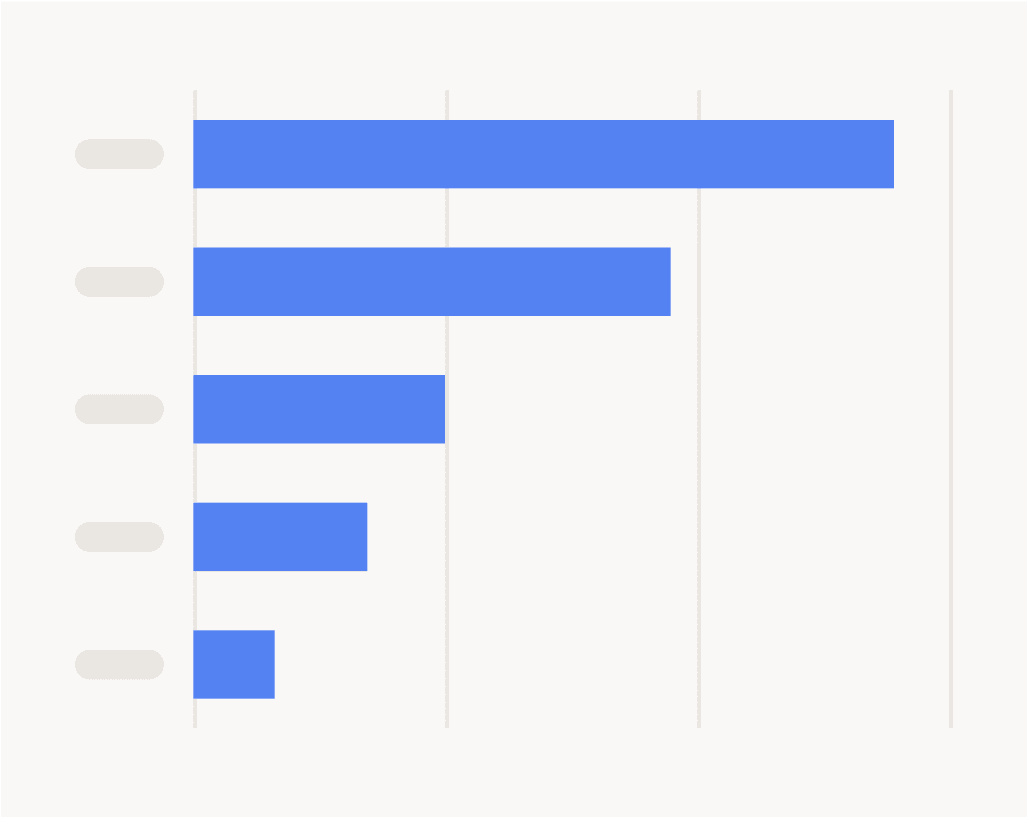

Funnel analysis
Monitor conversion rates with multi-step funnels. Build them with all your customer data for cross-platform views.


Goal attainment
Set a team goal and monitor progress toward achieving it. See how it compares over the previous period.
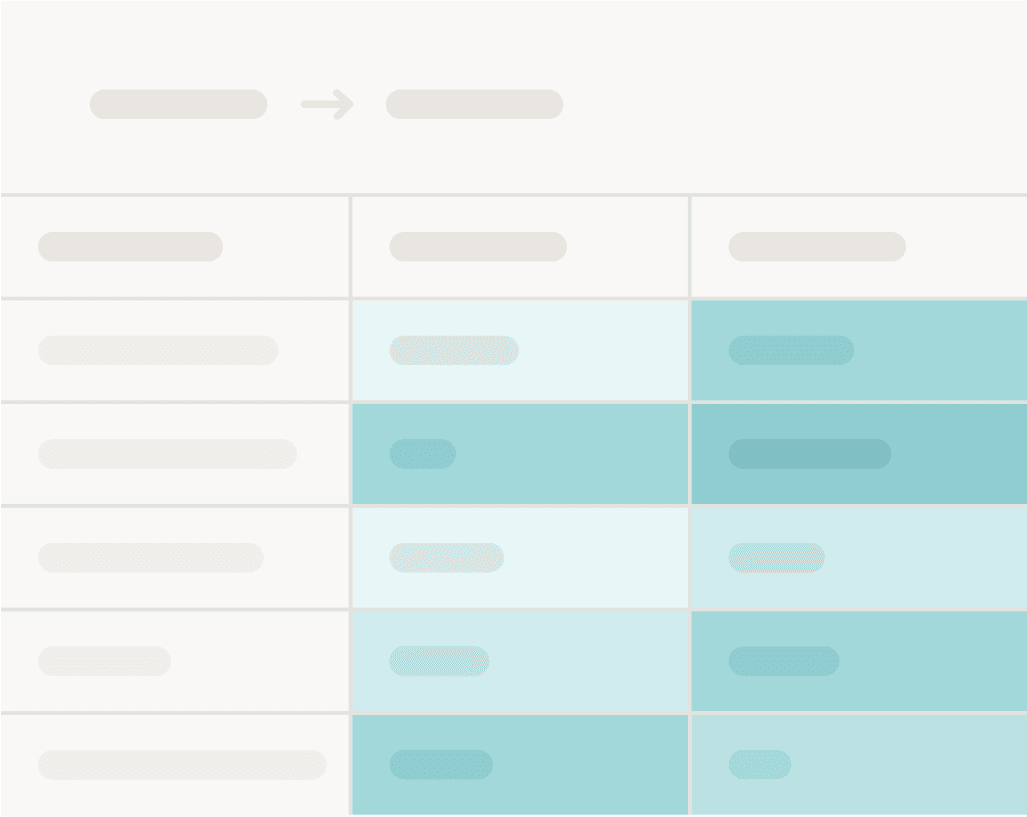

Cohort analysis
Measure the behavior of related groups of users to see how engagement activities are trending over time.

Engagement reports
See campaign-level metrics and benchmark them against your other campaigns. Monitor how engagement trends over time

Campaign attribution
Understand how your automations are influencing revenue. Use breakdowns to spot the strongest or weakest performers.

Funnel analysis
Monitor conversion rates with multi-step funnels. Build them with all your customer data for cross-platform views.

Goal attainment
Set a team goal and monitor progress toward achieving it. See how it compares over the previous period.

Cohort analysis
Measure the behavior of related groups of users to see how engagement activities are trending over time.
Explore related features
Explore related features
Explore related features
Pricing
Integrations
Pricing
Integrations
Pricing
Integrations


