Customer lifetime value formula definition
Let’s start this off with a question. Do you know the point (how many months) it takes for your business to recoup the investment that was required to earn a new customer? If you are not sure, then keep reading as this figure will help ensure your company is profitable, now and into the future.
Customer lifetime value seems to be the current darling of the SaaS metrics world, but it’s not the easiest metric to implement and use. We are here to explore the world of customer lifetime value, including how to measure CLV, and use it to gain key insights into the loyalty of your customers.
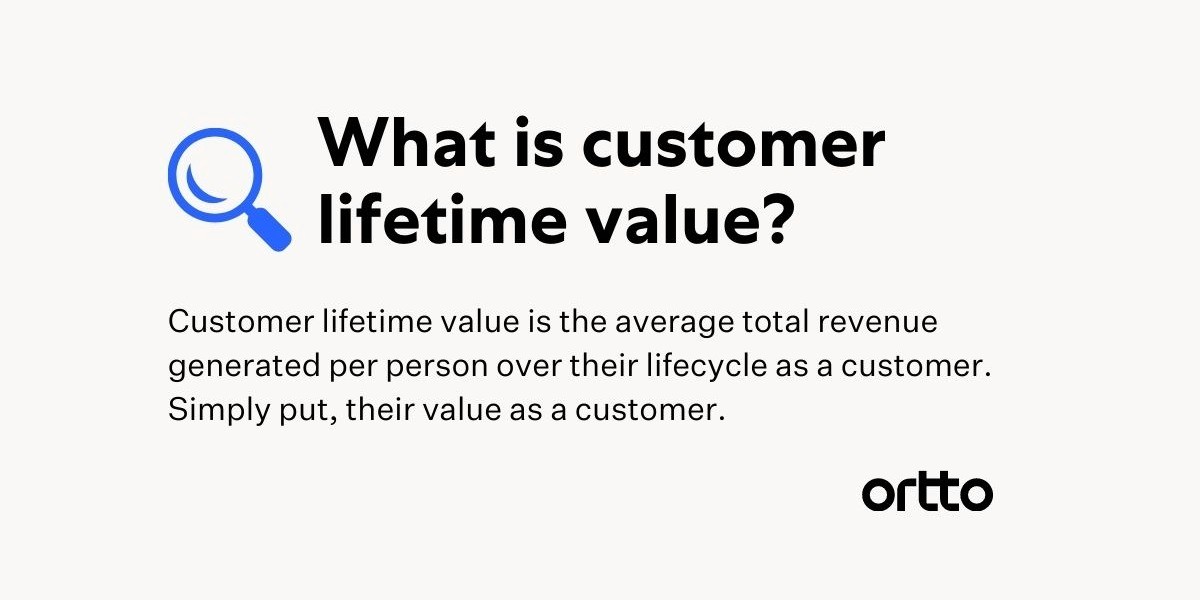
You may also recognise customer lifetime value from one of the various acronym aliases CLTV, CLV, LTV, no matter which alias you choose to use, it’s going to become your number one ally for measuring customer loyalty. .
Customer lifetime value formula importance
We know that customer acquisition is not cheap. Studies have shown it’s more costly to acquire new customers than it is to retain existing ones. In fact, gaining a customer can cost between 5 to 25 times more than retaining an existing one and the Pareto Principle suggests that 80% of your profits will come from just 20% of customers.
By placing emphasis on your CLV, you will:
Prove your business is viable and sustainable
A high CLV demonstrates that your brand and product is resonating with your customers and has a place in the market. Whether you're proving business viability to stakeholders or seeking investment to expand, a high CLV gives a clear sign that you've built a sustainable business with the potential for growth.Get a more accurate understanding of ROAS on acquisition campaigns
When you place emphasis on your CLV, that high acquisition cost suddenly doesn't seem so high at all. On average, loyal customers are worth up to 10x as much as their first purchase and spend 33% more than new prospects. Calculating your CLV will help you get clarity on the long-term revenue generated from your campaign spend.Gain insights on your most effective marketing messages and channels
While a customer is unlikely to respond to every nurture journey, newsletter, remarketing campaign, or marketing message you send, the consistent brand exposure could be adding up to something bigger than a CTR. By tracking CLV, you can get a better understanding of the messages and campaigns that drive revenue, and use these insights to increase revenue from your less valuable customers.Monitor and optimize toward steady growth
We all love to see those big growth spikes that happen with major campaigns, product launches, or feature releases, but steady growth is an indication your business is set up for long-term success. By measuring CLV consistently, you can monitor and optimize for growth that lasts the distance.
How to calculate customer lifetime value formula
CLV is one of the most important metrics you’ll come across as a marketer, especially if you work for a company currently in its growth stage. Measuring your CLV relative to the cost of customer acquisition (CAC) allows you to calculate how long it takes to recoup the investment required to earn a new customer, for example, cost of sales and marketing.
One important point to remember before we go into the calculation is your CLV will need to be higher than your acquisition cost for your business to be generating revenue.
CLV Formula
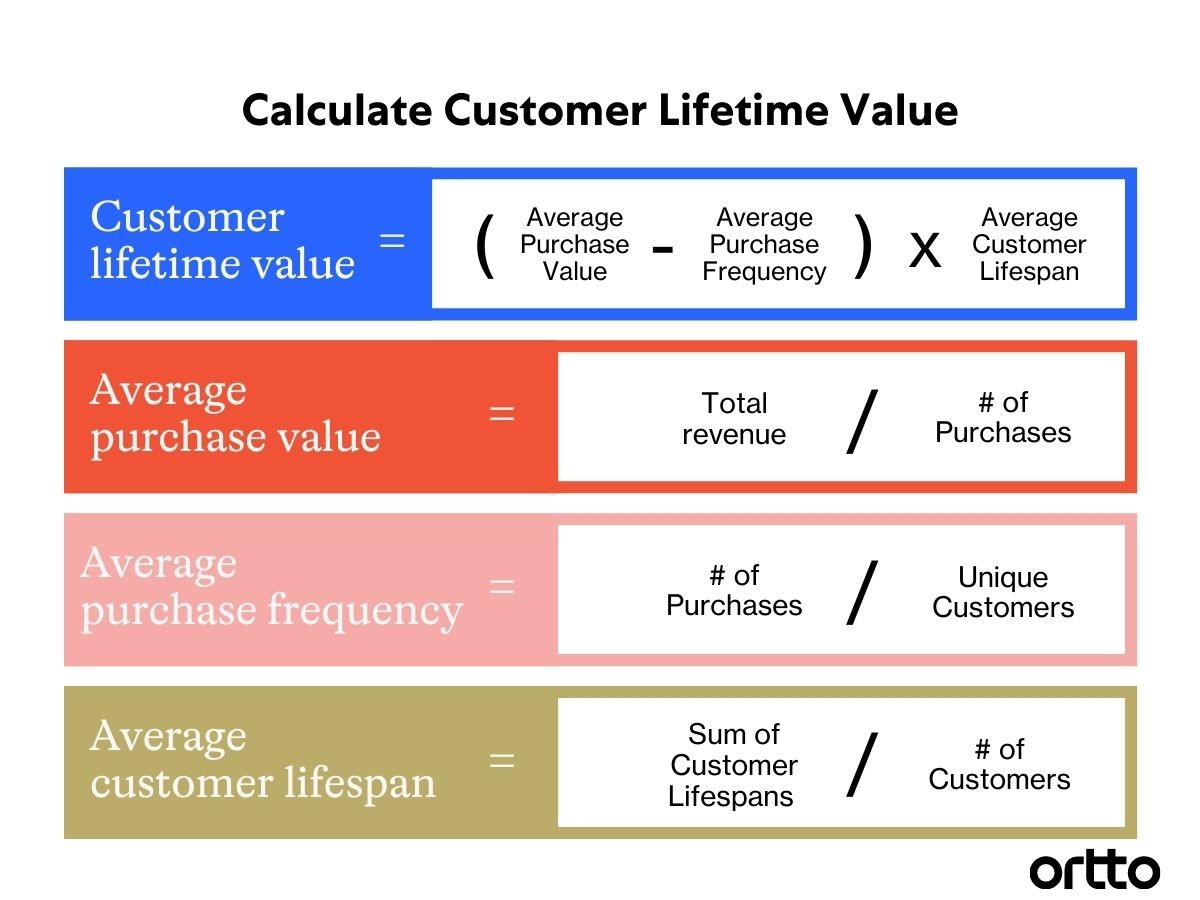
We have four steps listed below to guide you through the CLV formula. Along with the calculations you need to know, we’ve also provided an in-depth example to help you follow along and take these practices away to use for your own business.
Let’s begin. Imagine you own an ecommerce website selling Napa Valley wines. For simplicity’s sake, your business has five regular customers. Here are the steps you must take to calculate your business’ CLV.
Step 1 - Calculate average purchase value (A)
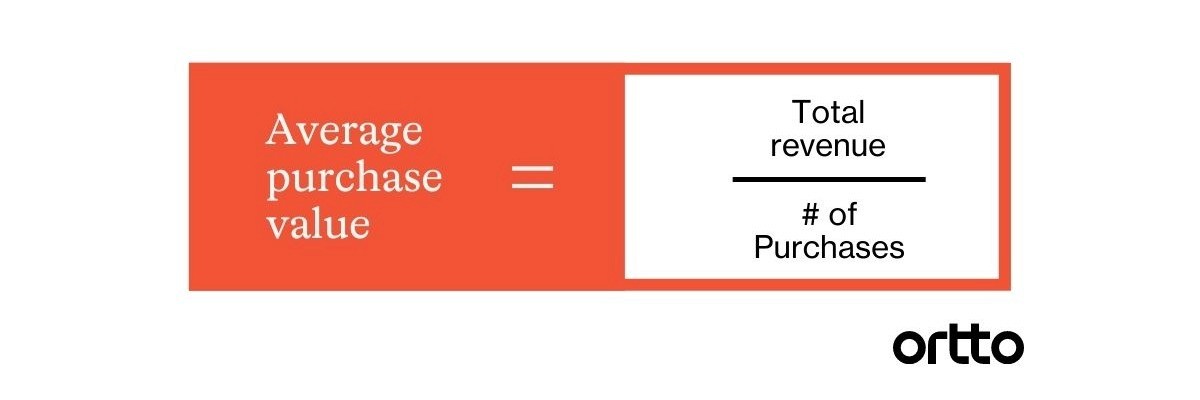
The first step involves calculating your customer’s average purchase value. This is done by getting an average of how much a customer spends on each visit during a specific time period, whether it be a week, month or year.
In this scenario, let’s say we want to calculate your monthly CLV.
Customer A may visit your website three times a month, spending $240 all up. Their average purchase value would be $80 per month. Once we determine the average purchase value for the first customer, we can do the same for your remaining customers (shown in the table below).
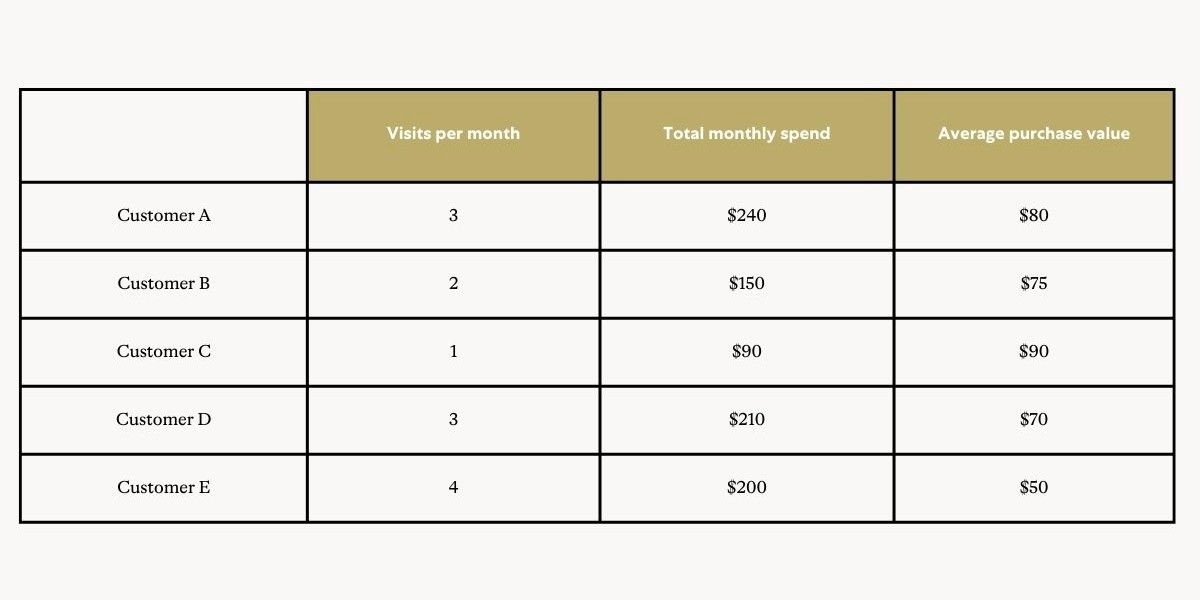
We will then add each average together (so, 80 + 75 + 90 +70 + 50 = 365), divide that amount by the number of customers (in this case, 5) to get an average purchase value of $73.
Step 2 - Calculate average purchase frequency rate (B)
This step involves measuring the average purchase frequency rate. We divide the number of purchases across the selected time period by the number of unique customers who bought from you during that time.
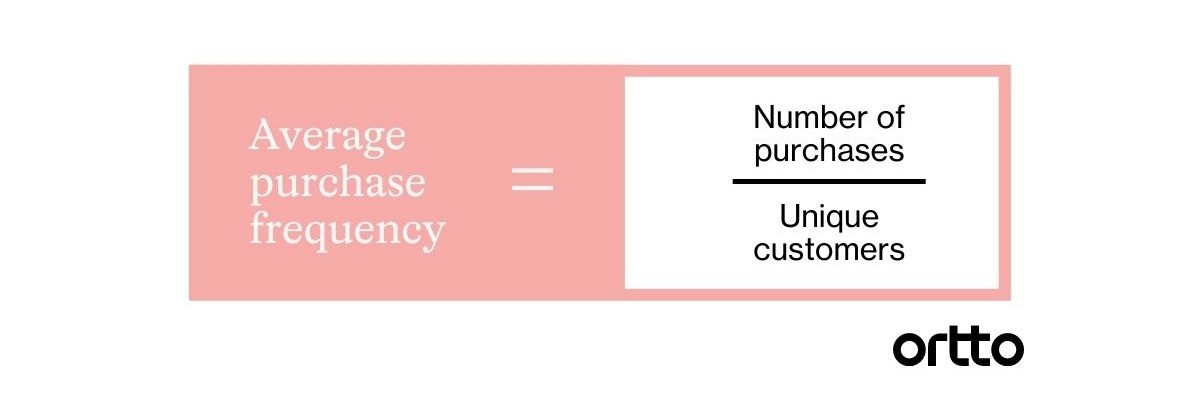
In the case of your wine business, we’ll need to find out how many visits the average customer makes to your website in a month; a website tracker can help with this.
Using the table in A, we can add up all the visits made in a month and divide the figure by 5.
So, 3 + 2 + 1 + 3 +4 = 13;
13 divided by 5 is 2.6 so our average purchase frequency rate is 2.6.
Step 3 - Calculate average customer value (C)
We now know how much your average customer spends and how many times they are likely to visit your website each month. We can now work out their customer value.
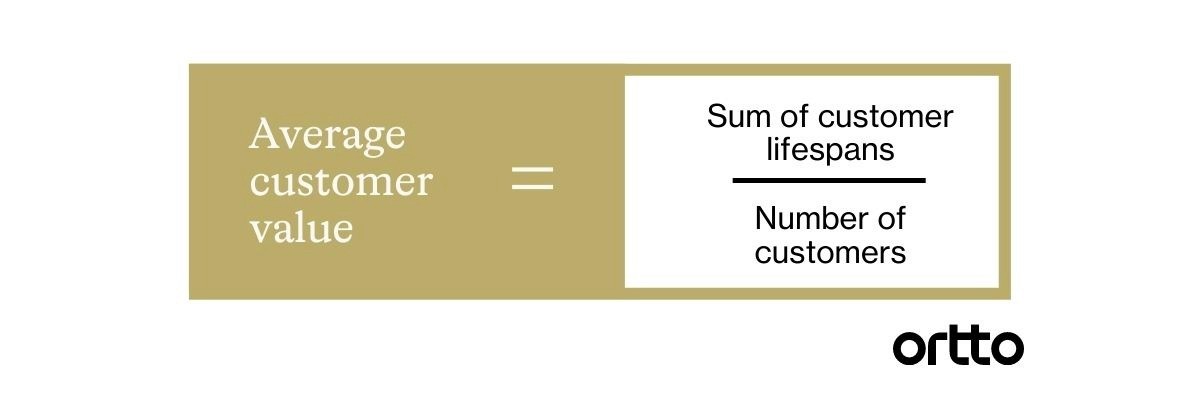
This involves looking at all your customers individually; we multiply their individual average purchase value (from the table in A) by the average purchase frequency rate determined in B. The customer value tells us how much money each customer is worth to your business per month.
Using the wine business as an example, the following table tells us what each customer brings to your business each month.
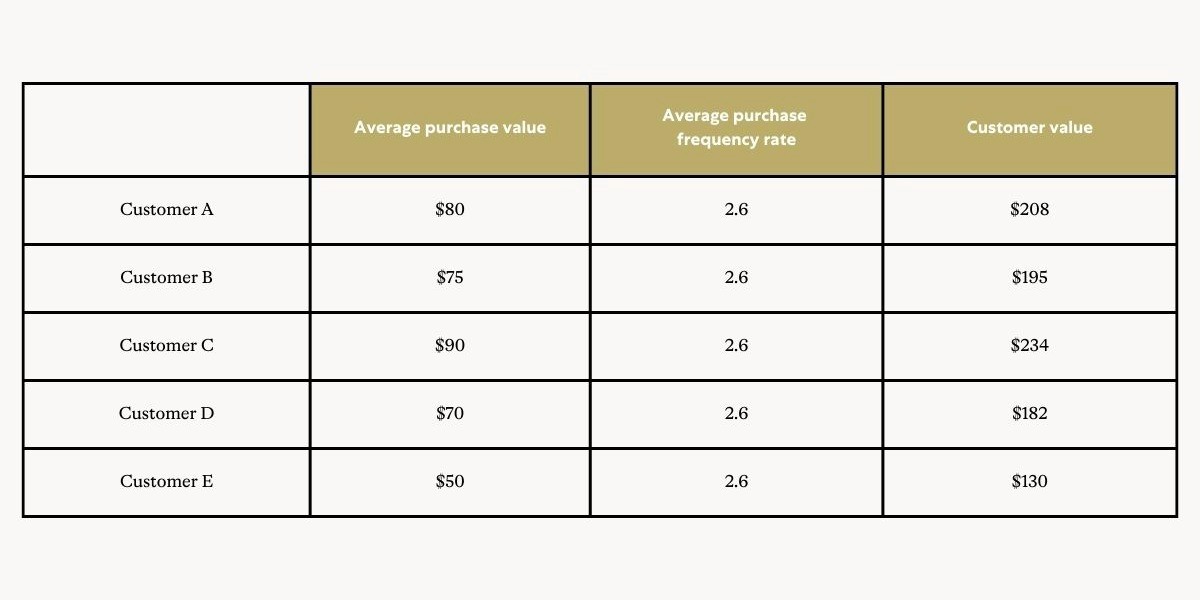
To calculate the average customer value, add each customer value and divide the total by 5.
So, 208 + 195 + 234 + 182 + 130 = 949 divided by 5 gives us an average customer value of $189.80.
Step 4 - Calculate average customer lifespan (D)
Step 4 is tricky because we cannot accurately predict how long a customer will continue to buy from your business. There are several ways you can calculate average lifespan; you can look at historical data or you can divide by your churn rate percentage.
For our example, the average online shopper stays loyal to one brand for 20 years. For simplicity’s sake, let’s say your average customer will buy from your website for the next 20 years.
Time to calculate the CLV
Now that we know how to work out the average customer value (C) and average customer lifespan (D), we can finally calculate CLV.
We do this by multiplying the average customer value (C) by
The frequency of the specified time frame within a year; and
The average customer lifespan (D)
In this example, we are measuring our customers’ monthly shopping habits, so we must multiply their customer value by 12 to reflect an annual average. If you set your time period to a week, then you’d multiply their customer value by 52 and so on. After that, multiply this number by the customer lifespan value to get the CLV.
For our wine business example - we worked out the average customer value was $189.80 in (C); we multiply that by 12 (as we are measuring their monthly habits) and then by the average customer lifespan value (20) to get a CLV of $45,552 ($189.80 x 12 x 20 = $45,552).
The CLV gives you an estimate of how much revenue you can reasonably expect an average customer to generate for your business over the course of their relationship with you.
CLV calculation drawbacks
The formula above is simple enough to calculate, but you may be thinking, “Is such a simple formula useful to me in the first place?” Here are some key drawbacks to estimating LTV using the above formula:
It doesn’t account for any MRR expansion. If your product has a steady expansion of accounts (fairly common if your pricing scales with the size of the customer) then the LTV estimate here is likely to be low.
It assumes that churn occurs linearly, which is almost never true for SaaS businesses. In most cases this is some form of curve, with a higher churn rate earlier in the customer lifetime.
It only accounts for gross subscription revenue. If you have significant revenue outside your core subscriptions, the estimate you reach may not be helpful knowledge at all.
If you’re a young business with just a few customers, estimating LTV is not likely to be useful to you. Varying churn with such a small number of customers would lead to a very volatile number that won’t be helpful in the long run.
A tip to consider - try experimenting with a 12-month LTV, which could lead to a more reliable estimate if you’re really struggling to get to a good estimate of the lifetime. According to the simple definition above, there are only 2 metrics you can influence in order to have an impact on LTV; Average Revenue Per Account (ARPA) and Customer Churn Rate. Increasing the former, or decreasing the latter will result in a higher LTV.
5 simple ways to grow your SaaS customer lifetime value
You’re here to help increase the longevity of your customers' lifetime with your company. Let’s get started on what steps you can take right away in order to keep your customers longer, increase the average amount they spend with you and at the same time keep them satisfied with your product.
1. Focus on customer success to reduce churn
We would like to introduce you to your new friend, the Cohort Analysis chart:
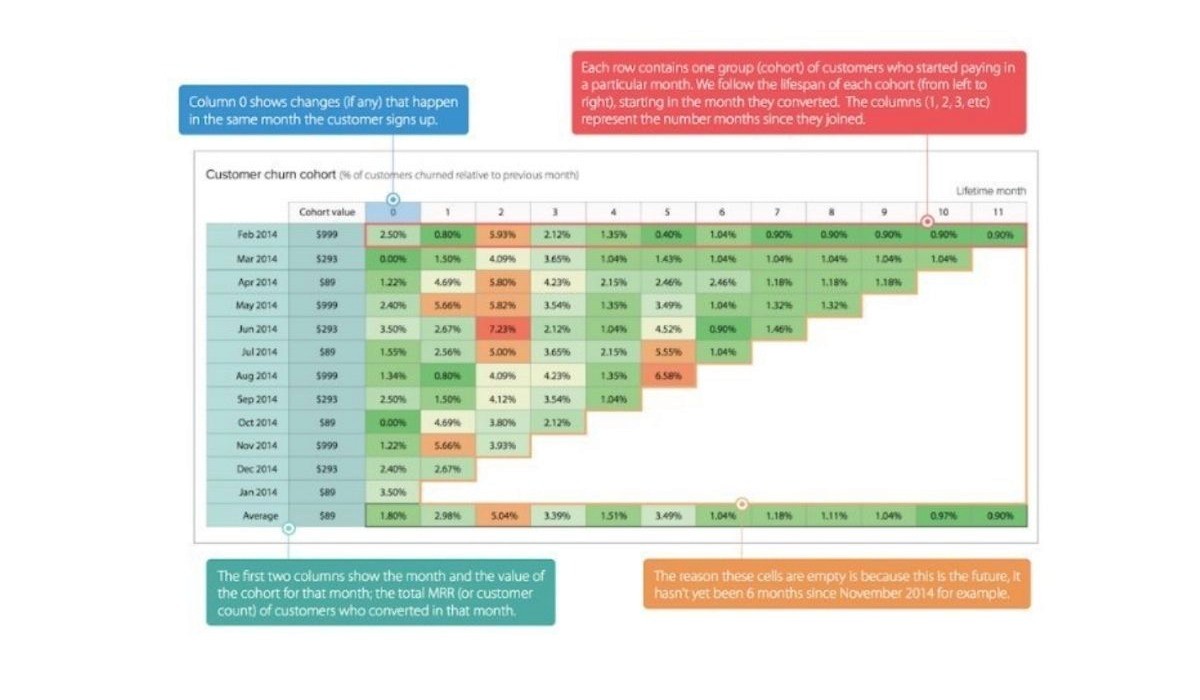
This chart has a really useful function - expose which specific months in your customers’ lifetime are the highest risk for churn. Looking at churn rate per cohort is a great way to instantly identify where (if anywhere) you have a problem with churn, and to take immediate action by focusing your customer success efforts in such a period (or just before it).
Let’s say, month four has a much higher churn rate than any other, talk to your customers who are entering month four, and try to identify any problems they’re experiencing, or goals they’re not achieving with your product. The feedback received may require product improvements, or a better onboarding or support process.
We are not expecting you to remember when all your customers are entering a typical ‘high-churn’ area. Ortto can help you with this, simply set up customer segments, and corresponding alerts, so you know when a customer enters a high churn risk period.
Go one step further and reach out to them with an automated message to kick off some dialogue. Another way to understand how your customers are feeling is to send out a regular NPS survey. You’ll be amazed at the quality of feedback you get just from sending out a simple question.
The moral of the story here is by focussing on customer success and lowering churn rate at critical periods your LTV will increase.
2. Scale your pricing to increase account expansion
A great way for SaaS businesses to increase their ARPA (and subsequently LTV) is to make sure that the pricing model allows for account expansion throughout the lifetime of the account.
Scalable pricing is a great way to do this - it allows you to lower the barrier to entry for smaller customers and still leverage the higher margins found at the enterprise level. It’s possible to scale SaaS pricing based on one of a number of factors, commonly:
Number of active customers
Number of “seats” (operatives) required
Customer Monthly Recurring Revenue (MRR)
Infrastructure requirements, e.g. cloud storage space
The requirements for all the above are likely to increase over time as a company grows. If your pricing increases with the growth of your customers, this lays the groundwork for significantly increased LTV due to healthy account expansion.
The result of implementing scalable pricing will equate to a higher account expansion, meaning a growth on ARPA, and ultimately ending up in a higher LTV.
3. Add ‘sticky’ features inside your platform
This one’s interesting, and always brings up some conversation, specifically with the term: “user lock-in”.
The idea of adding metaphorical prison bars to your product to make it difficult for users to leave - even if they want to - is generally frowned upon in SaaS, and something we do not recommend.
What does make sense though, is what people most likely mean when they use the term ‘lock-in’. It is to build features in your product that allow customers to create their own data and add further value inside your platform. This makes them hesitant to leave, because they’ve invested time and effort into building important processes, tools, and information systems inside your ecosystem.
Here are a few examples to bring the stickiness of certain features built:
A cloud storage solution could add social features that allow users to add notes, annotations and discussion layers on top of their files.
An analytics service could allow customers to build their own custom user segments and reports inside the platform.
4. Re-engage inactive customers to improve customer satisfaction
The chances are, there’s a proportion of your customer base that hasn’t engaged with your product for a scarily long time. At this point, they’re basically churn to you.
Putting a re-engagement strategy in place can be a great way to reactivate them, and help them discover or rediscover the value of your product.
On the other hand, there may be hesitance by some as customers are now reminded they don’t really want the service on offer and the emails will prompt them to actually churn.
Yes, this might actually happen. And you might see an initial peak in churn when you do this for the first time. But in avoiding this, you’re really just fooling yourself about those inactive customers. If all it takes for them to churn is a reminder that they’re still subscribed to your service, they’re simply inflating your Monthly Recurring Revenue (MRR).
In the long run, actively keeping all your customers engaged is much more likely to lead to improved customer satisfaction and loyalty, in turn driving higher LTV.
5. Introduce premium features, enticing customers to upgrade
Another great way to drive bigger account expansion is to tempt customers onto a higher pricing tier, through introducing great premium features that suit enterprise or power-user customers.
The best thing about this method is that there’s a much lower risk of angering customers by forcing them onto a higher priced plan. The ones who upgrade actually proactively choose to upgrade, because they want the additional features.
The final word
The simplest way to grow your existing SaaS business without acquiring new customers is to have a solid grasp on the CLV of your business, and achieve high-confidence measurable results from the CLV growth strategies you implemented.
Businesses that are actively geared towards creating a memorable customer experience are more likely to generate higher revenue because of increased customer satisfaction. Or simply put, the happier your customers are, the more likely they are to spend more money.
Author

More by Sidney O'Connell
Sidney O'Connell has no more articles


