Dashboards are not just for those sitting at a c-suite or executive level, they can help your employees feel accountable for their achievements, work agilely when improvements are needed and align teams to work towards the same business objectives. At the end of the day, you want your team to understand what success looks like.
With so many reports and metrics to keep across, dashboards provide an easy, uncomplicated way to capture the health of the business. Ortto asked professionals within B2C and ecommerce industries to see what dashboards they use to help drive results.
Marketing dashboard
If you’re spending money on campaigns and paid channels, then meticulously tracking every dollar spent, attributing to conversions and measuring the ROI, is a must. A marketing dashboard will help you keep check of costs, ROI, and success across all your marketing channels.
A marketing dashboard that focuses purely on their Shopify ecommerce store has proved to be very beneficial to the team at NULEEV. The Chief Marketing Officer, Robert Burns finds that, “it gives us real-time customer analytics so that we can adapt on the fly when necessary, or wait until more data is collected from a new marketing campaign, then reevaluate.”
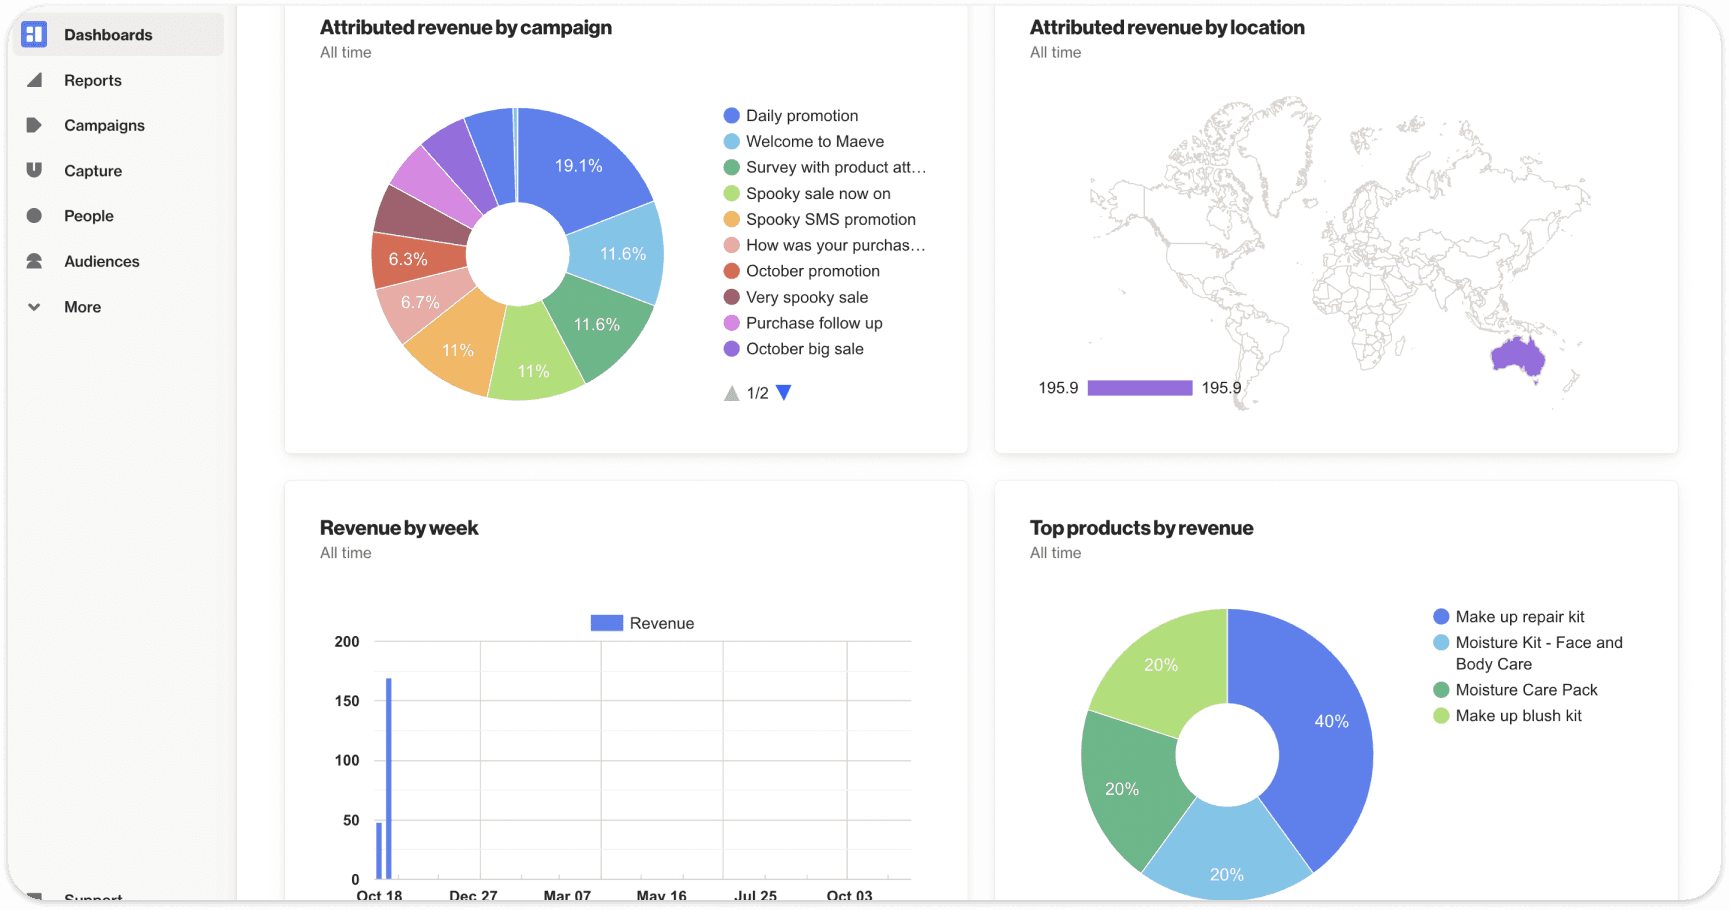
“Our conversion rate and ROI for each channel are the most important metrics that we track closely. For every new campaign, the ROI and conversions determine what the budget will be going forward. After that, we closely monitor the Cost of Customer Acquisition, Customer Retention, and Customer Lifetime Value,” Burns continues.
Lisa Richards, the CEO, and Creator of the Candida Diet has set up individual dashboards for every essential business function, including marketing. As a critical factor to keeping an eye on the bus
iness as a whole, “these dashboards serve to help us visualize data across all our business activities, which allows us to identify valuable insights about the overall performance of the company. These insights enable us to make data-driven decisions from the granular level outwards, resulting in more optimized business performance.”
Top reports to include in your marketing dashboard:
Conversion rate
Return on investment
Cost of acquisition
Revenue
Orders
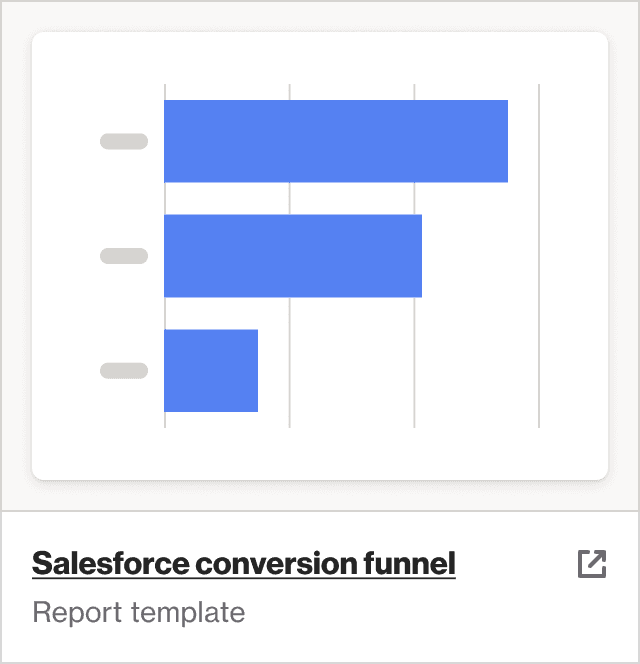
Average order value
Customer lifetime value (CLV)
Customer experience dashboard
If you are not already dedicating time to look at your customers experience, then take this as a sign to start. Both positive and negative feedback will give you enormous insight into how your company and processes are performing.
Dan Potter, Head of Digital for CRAFTD, knows the impact of a comprehensive customer experience dashboard. He shares, “as far as metrics go, one that I started to look at more recently is customer experience. What are users saying about receiving their merchandise? Is checkout smooth? How about the return process?”
“All of these insights are important and influence how we move forward. There’s always something that can be improved for the customer,” he continues.
Sonia Navarro, Founder of Navarro Paving agrees and has found this type of dashboard to be, “an all-in-one solution to track customer behaviors for us. It provides us with a clear-cut view of how users interact with our products and shows their response rate for our brand.”
Navarro emphasizes its importance. “Remember, user experience is a critical element for any business to succeed. This is why a user experience dashboard is absolutely essential for our brand to remain updated about our customers.”
Top reports to include in your customer experience dashboard:
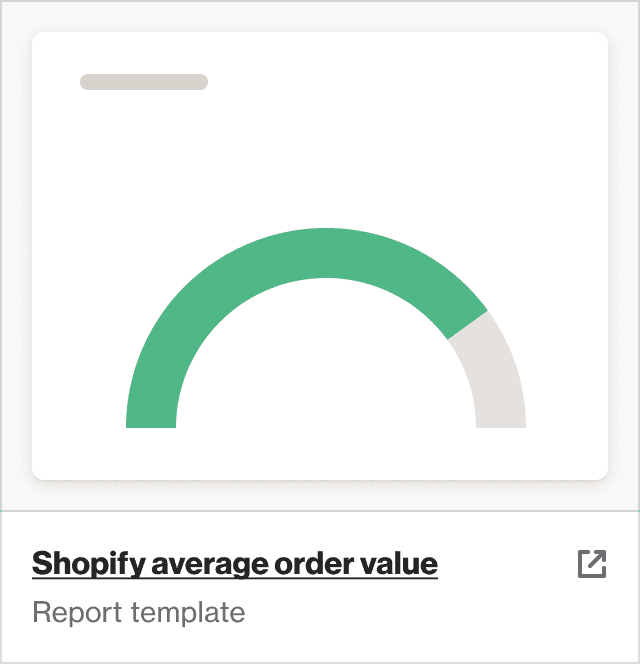
Orders vs returns
Tickets by tag
Customer retention rate
Customer churn
Customer satisfaction score
Customer journey analytics
Social media dashboard
Expedition Coordinator of Ultimate Kilimanjaro, Shawn Richards explains, “social media is without a doubt the most important aspect of our business. A lot of platforms have some useful features already built in to help you view how your audience engages, but a dashboard grants you much more power.”
Along with the typical vanity metrics like the number of followers, engagement rate, and reach, Richards also includes audience demographics in his dashboard. “Some of the most important features, in my opinion, are the ability to view the age of those who engage with your posts, seeing how far a reach your profile and posts have, and the top performing post.”
He continues, “seeing the age of your followers can allow you to improve your marketing strategy by focusing directly on them. In the case of our business, we have to consider people's ability, so seeing this data can help us plan for accommodations.”
“Being able to view your reach can show you what kind of person is looking at your post; by seeing their profile, you may be able to determine their work sector or could help you to narrow down your audience groups.”
“By being able to see which of your posts performs best, you can learn from it and build a strategy around it by analyzing what went well and how you can capture lightning in a bottle twice.”
Top reports to include in your social media dashboard:
Followers
Reach
Engagement rate
Demographics
Best performing posts
Customer retention dashboard
In a customer-centric business setup, the customer retention dashboard will help you hone in on strengthening customer relationships and building loyalty and advocates.
Customer retention metrics include customer retention rate, churn, customer lifetime value or repeat purchase ratio, and for Jim Tevors from We Review Tires it’s their ultimate dashboard. He states that it, “helps our team understand how we've been able to keep return customers and if we should make more of an effort to get them coming back through the door."
Top reports to include in your customer retention dashboard
Customer lifetime value (CLV)
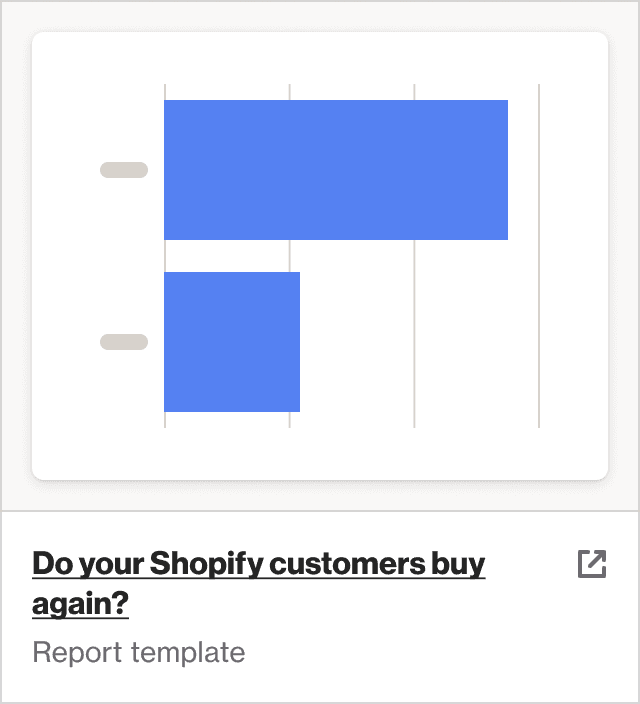
Repeat purchase ratio (RPR)
Customer churn rate
Customer satisfaction score
Web analytics dashboard
As an ecommerce business, having a comprehensive web analytics dashboard is pivotal to your longevity and success. Monitor the performance of your website by tracking web metrics like traffic, bounce rate, conversion rate and session duration. These metrics will also indicate your customers overall online experience.
C.T. Price, CEO of Life Grows Green shared why they use a web analytics dashboard, “we can better reach our customers and provide them with the best possible service. It is vital to know how customers are engaging with your website to ensure that everything is easy for them to access, so this data provides great insight.”
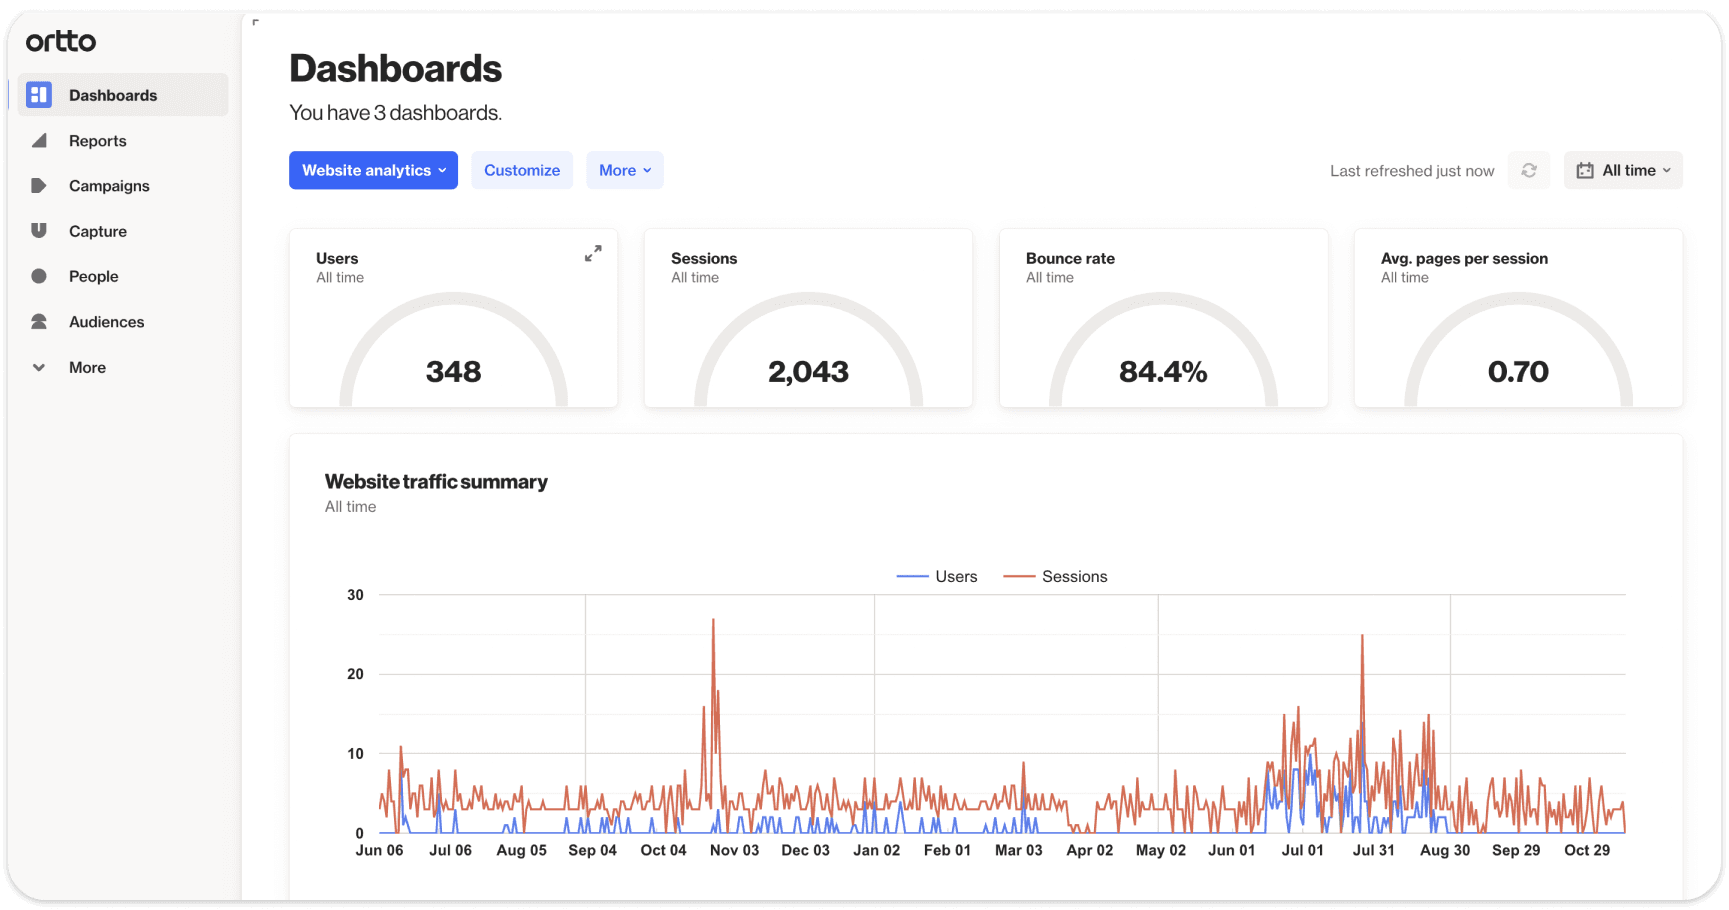
Beyond the typical performance metrics, Life Grows Greens looks at whether the page views are new or returning customers. Price continues, “this benefits us massively as it helps us to infer who is actually interested in our service and if it has staying power. The majority of revenue should, in theory, come from returning customers. They trust your brand and will likely continue to show support in future. By finding out how long they are active on your page and comparing it, you can see if they are becoming less interested in your site or store page. If so, you need to make changes.”
Seeing what visitors are searching for within the website is a metric that Lexi, Founder of Alexis Jae Jewelry ensures is included in her dashboard. She shares, “this helps me see future demand and we can craft our social media around it.”
Top reports to include in your web analytics dashboard:
Traffic
Bounce rate
Conversion rate
Session duration
New vs old website visitors
Search terms within the website
Sales dashboard
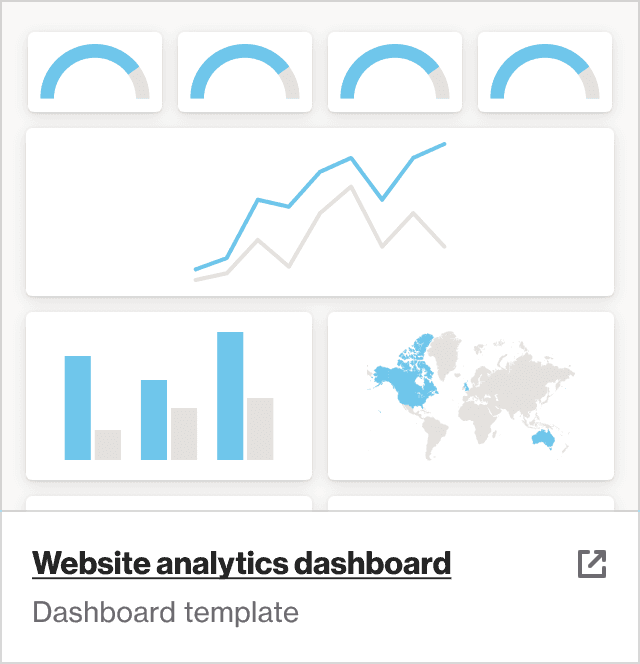
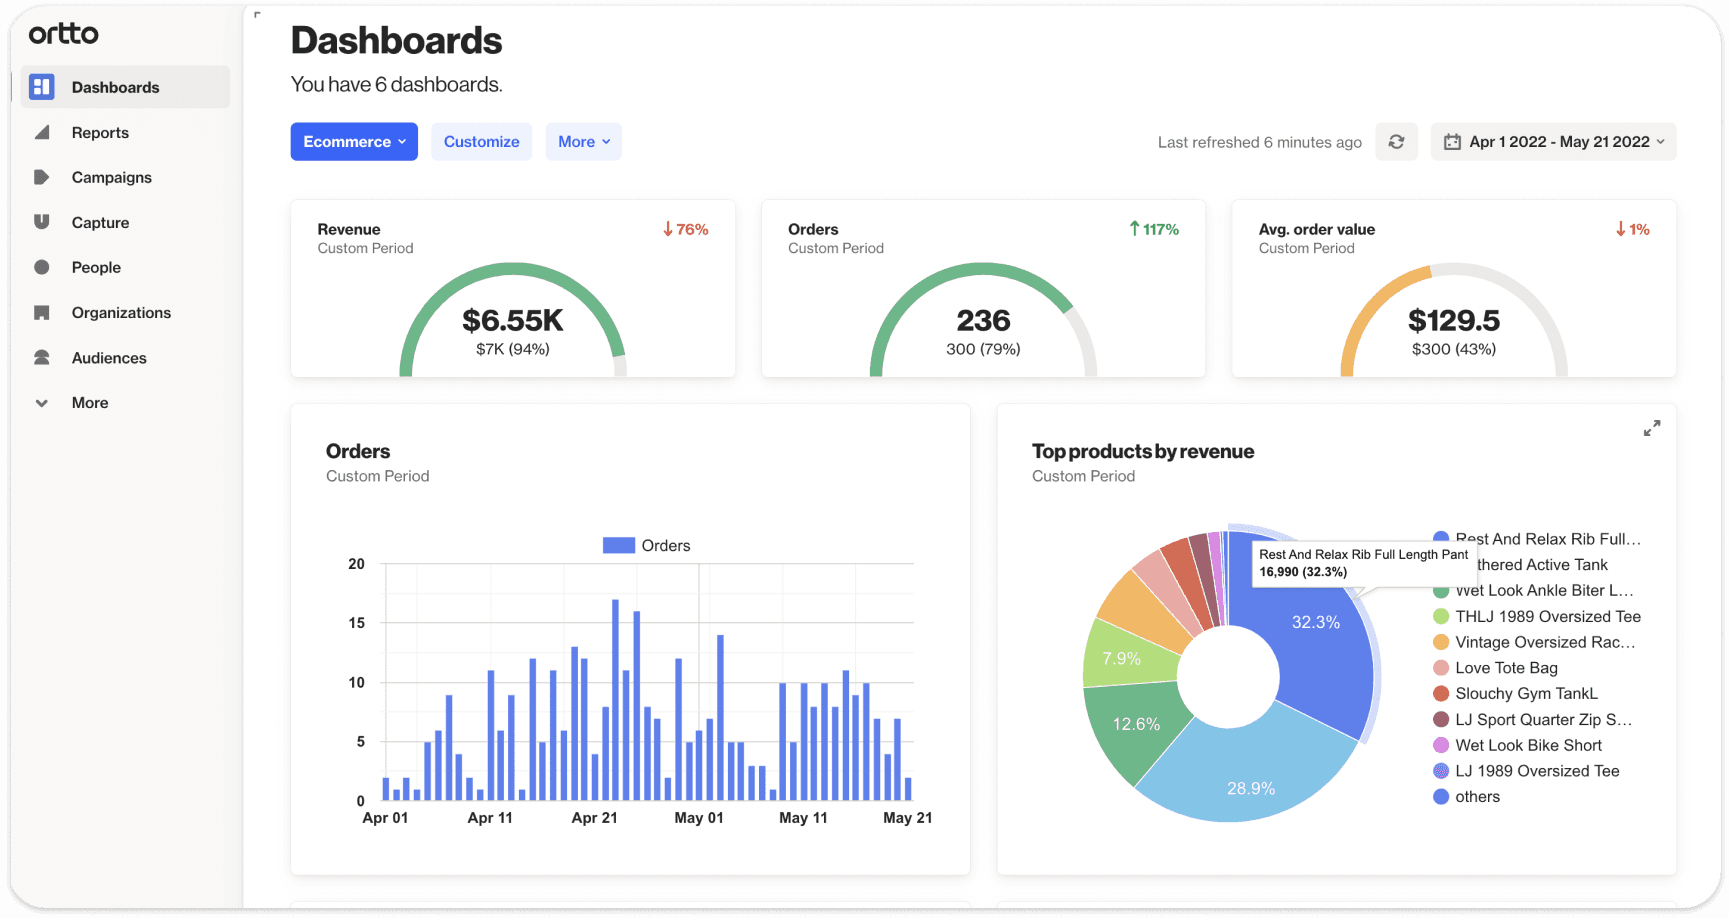
Monitor the sales metrics that matter most to your business in an easy-to-read, visual format. A sales dashboard will empower your team to take ownership of the pipeline, they can see what is working and what needs improvement.
Alex Williams, an ecommerce business owner of FindThisBest, relies on the sales dashboards to help, “streamline the company’s internal operations and makes sure that our profit margin remains steady even when economic conditions are uncertain. Such dashboards can provide an instant overview of all aspects of the sales process, from lead generation to forecasting and everything in between.”
Williams continues, “a sales dashboard allowed us to identify opportunities for improvement. We can now acquire information about the performance of individuals within no time. This allows us to make informed decisions in a steadfast manner.”
Top reports to include in your sales dashboard:
Revenue
Costs
Attribution
Highest selling products /services
New customers
Growth dashboard
Every company will have different metrics included as part of their growth dashboard. Similiar to other dashboards it’s important to consider what metrics are needed to achieve your business objectives.
According to Patrick Wilson, the Hiring Director of SkillCourses, “The reason behind including a growth dashboard in our practice was to track our growth in all areas. We can't run our business without this dashboard because we're always building on the results it gives us. It helps us understand the scale of our performance. Moreover, it provides important data about how we can sustain our company for a long time.”
Top reports to include in your growth dashboard
Sales pipeline reports
Average sales cycle reports
Growth rate
Gross profit
Net profit
New customers
Final word
To make your life easier, choose a platform like Ortto, which can pull analytics from a range of different data sources enabling you to view a complete picture and provide transparency on the performance of your business.
With templates on offer and a variety of report styles to choose from, you can build a customized dashboard to fit all the business critical KPI’s you need to keep an eye on.
Start exploring B2B dashboards in Ortto today.
Author

More by Meagan Philpot
Meagan Philpot has no more articles


