Outline
- Introduction
- What is customer churn?
- Why churn matters
- Types of churn
- Calculating and monitoring churn
- 12 strategies for reducing customer churn
- The final word
Subscribe
Churn is the common enemy of all subscription-based businesses. It refers to the rate at which you are losing customers, and it has an outsized impact on a company's overall health and long-term viability.
In this article, we’ll explore:
What customer churn is
Why churn matters
Types of churn
How to calculate churn
12 strategies for reducing churn
What is customer churn?
Customer churn refers to the percentage of customers who stopped using your product after a set period of time. The lower your churn rate, the higher your customer retention.
Churn is a part of doing business, and it is unrealistic to expect your churn rate to be 0% — customers are always going to leave for one reason or another. But there's a big difference between an expected and predicted amount of churn, and high or unpredictable levels of churn.
Why churn matters
Churn rate impacts all of your other key business metrics like customer lifetime value, retention rate, and total revenue.
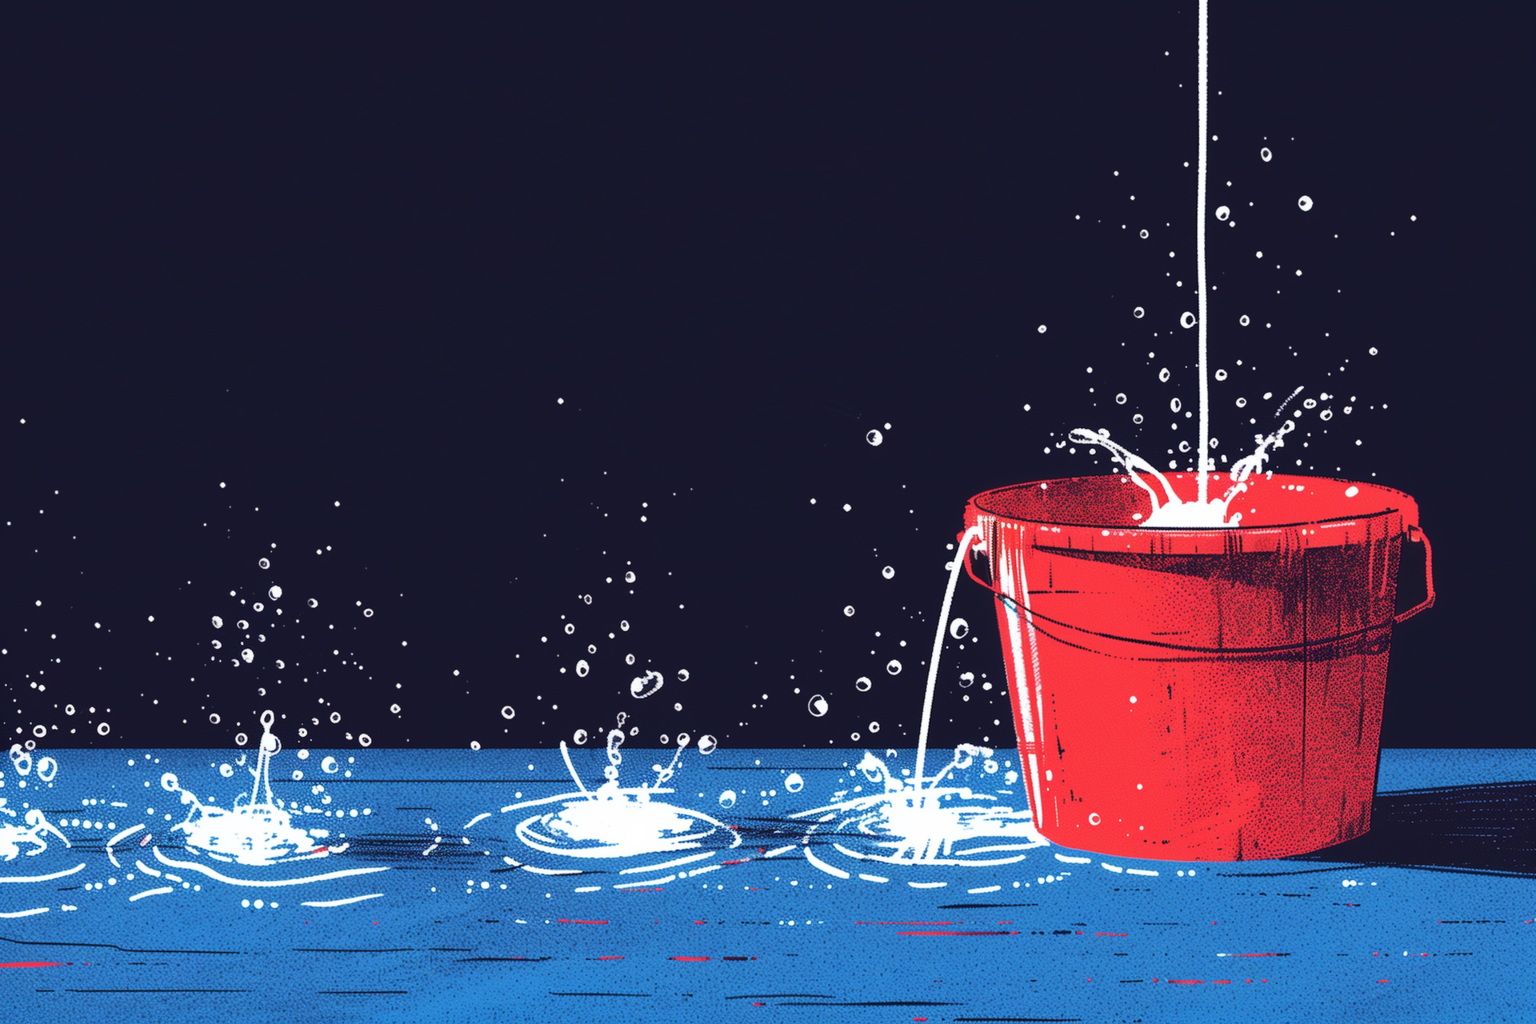
When you have a leaky bucket, you are constantly refilling it to keep the bucket level. This forces marketing and customer-facing teams to focus on acquisition, rather than retention — and the cycle continues.
When churn is reduced, your new acquisitions are not replacing lost revenue, they are net new acquisitions — and therefore help your business grow. A reduction in churn will also allow you to focus on bigger growth initiatives, like expanding existing customers, increasing lifetime value, and converting and retaining new business.
Types of churn
There are two main types of churn: voluntary and involuntary.
Involuntary churn occurs when payments are declined or something else goes wrong in the process of renewing.
Voluntary churn occurs when the user decides to end their agreement because they’ve found a better or more cost-efficient solution or your product is no longer serving their needs. This is the type of churn we’ll be focused on here.
Within the broad category of voluntary churn, there are three distinct phases for a SaaS business:
Onboarding churn (0-30 days)
Mid-stage or results phase churn (30 - 180 days)
Long-term or loyalty phase churn (180+ days)

Early-stage or onboarding churn is by far the most common, but it’s also the most avoidable. People who churn in this phase are typically struggling to get set up, have not realized the value of the product, or are yet to discover the features or use cases most relevant to them. Setting up personalized onboarding journeys that educate and support these customers will go a long way to assisting them.
In the results phase, your customers will be hoping to see real value in your product and will look at the results they are generating. Often, making tweaks to the onboarding process can help you avoid this phase of churn — the better customers are set up from the start, the better off they’ll be when they’re trying to prove ROI or make a case for the value of your product.
In the long-term phase, customers who churn may feel as though they are not getting enough out of your product, they may have been directly approached by a competitor or targeted via ads, or they might not be receiving the support they require. Proactively reaching out to customers showing signs of churn and providing an outstanding experience to your loyal customers can help you stop this.
Calculating and monitoring churn
The basic formula to calculate your business’s overall churn rate is simple — number of customers canceling their subscription per time interval, divided by the number of customers at the beginning of that interval.

For example, let’s say you’re looking at churn for Q1. At the start of January, you had 5,000 customers and throughout the month you lost 250. This would mean your churn rate for Q1 is 5%.
Some businesses decide to calculate customer churn rate as a percentage of MRR instead of customers lost. In this case, you would look at your MRR for the month and divide it by the MRR you lost that month, minus any upgrades from existing customers. In this equation, you would not be including new sales for the month either, as you ultimately want to identify what was lost.
Many SaaS companies may also benefit from tracking subscription-level or downgrade churn — that is, the number of customers who downgrade their plan. Depending on the pricing model you’ve put in place, this kind of churn could be indicative of a feature that’s not quite working as intended, a usage level that is far and above what your customer really needs, or something else entirely.
If you are proactively focusing on reducing churn, it's worth setting up a dashboard dedicated to churn metrics and KPIs, and doing some deeper analysis to answer questions like:
What type of customer is likely to churn?
Are there any product actions that customers do or do not take before churning?
How do engagement scores look for customers that churn?
Which pricing tier is the customer most likely to be in when they churn?
Are there seasonal churn trends that could be eliminated with special offers or discounts?
Does churn happen at a specific time in the customer’s lifecycle? E.g. at the end of an annual contract?
Is the churn voluntary or involuntary (e.g. declined payment cards, incorrect payment information, or lack of customer assistance)?
12 strategies for reducing customer churn
Now that you’re analyzing churn, it’s time to take action and bring those churn numbers down. ProfitWell studies have shown that the average churn rate in SaaS is around 5%, and a “good” churn rate is considered 3% or less, but only one-third of SaaS companies are actually hitting this benchmark.
No matter what your churn rate is, the most important thing is to make continuous improvements to lower it. These strategies are designed to do just that.
1. Make your product a habit
We all know that starting a new habit is easier said than done. But it CAN be done. Products like Headspace, Asana, and Slack work well because they encourage us to log in every single day. And when a product becomes part of your daily routine, it's much harder to let it go.
Consider how your product can become a part of your user’s routine. It could be as simple as emailing your customers with a weekly update on their progress or using integrations to habit stack with their daily usage of popular products like Slack.
2. Focus on onboarding
We’ve said it before and we’ll say it again — a stellar onboarding process is absolutely crucial to success.
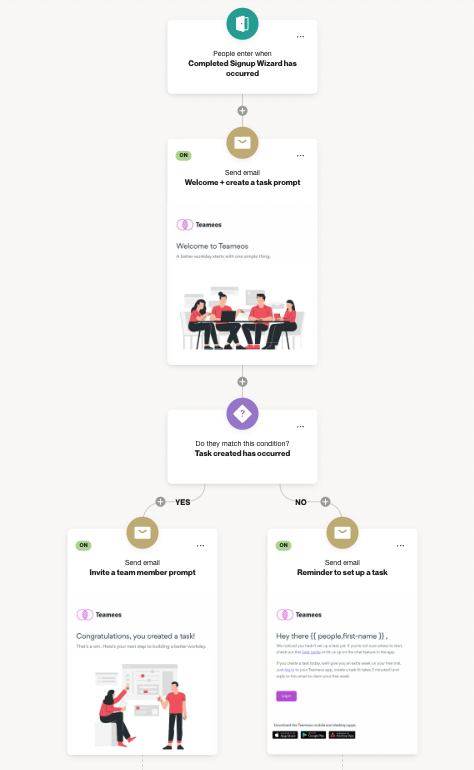
To do this, you'll want to start by looking at the actions your now-loyal customers took at the start of their lifecycle. Once you've identified some of the key activities that lead to loyalty, you can use your automated onboarding journey to nudge your new customers to take those same actions.
For example, perhaps you’re a productivity tool and you’ve noticed customers who make it past the 90-day mark are more likely to have set up a task and invited a team member within the first two weeks. You can then set up a journey encouraging them to take these two crucial actions and incentivizing them if the action is not taken by day 13. This simple journey can go a long way to nudge them towards value realization and reduce churn.
3 . Play with pricing
As a user, you’ve probably noticed a lot of companies offering huge discounts for signing up for an annual subscription. There’s a simple reason for this — once a product has been a part of a user’s life for at least 12 months, they’re likely going to struggle to give it up.
4. Overcome alignment issues
Sometimes early-stage churn starts before the customer has even become a customer. If your marketing, advertising, website, and sales messaging do not match up to the product experience, your customer may churn because their expectations have not been met.
This is rarely intentional, but it is unfortunately common, especially in products that are complicated and could be misunderstood in the market.
To avoid alignment issues, identify an ideal customer profile and their use cases with your product, then get cross-departmental opinion and buy-in. After that, you can master your messaging and pressure test it with market research, internal team members, or even existing loyal customers.
5. Test different educational tools
Perhaps you’ve gone all-in on video tutorials. Or maybe you’ve been reliant on written content and a few pre-recorded demo videos. The fact is, different people learn in different ways and while you can make some predictions about your audience’s preferred way to learn, the more content types you have, the closer you’ll get to ensuring every customer you have will find a way to reach their goals.
It’s also worth looking at pop-ups, tooltips, product tours, and even gifs to help users learn as they do. This is often the most effective way to teach your users about new features or hard-to-master features.
6. Track engagement closely
Tracking engagement in a CDP like Ortto will help you catch churn before it happens. When a customer stops using specific features, their daily logins decrease, or views the cancellation terms, it’s time for a proactive rescue mission.
Early intervention can go a long way here. Nothing beats a human touch, so the first port of call should be for the support or success team to reach out and offer help. If that's outside of your team's scope, you can use automation to help.
Simply set up a journey that is triggered when engagement starts to drop off, sending surveys, emails, SMS, or in-app messages that generate feedback and educate customers to help them see the full value of the product. It’s also a great idea to share some customer stories and specific use cases that may inspire them to reengage.
Even if they do eventually churn, this outreach could generate some useful feedback on why they churned so you can make changes and prevent others from doing the same.
7. Value realization emails
Spotify’s Wrapped is known for being one of the more viral content efforts of the calendar year. Social shares aside, it also happens to be a great reminder of the role Spotify plays in our life. We listened to that much music?! Learned from that many podcasts?! It's a feel-good moment that has been replicated in the value realization emails from many popular products.
Grammarly’s weekly report is another great example of this in a different space. It provides a great balance of celebratory moments to make the customer feel good, value realization moments, loyalty drivers, and a reason to upgrade.
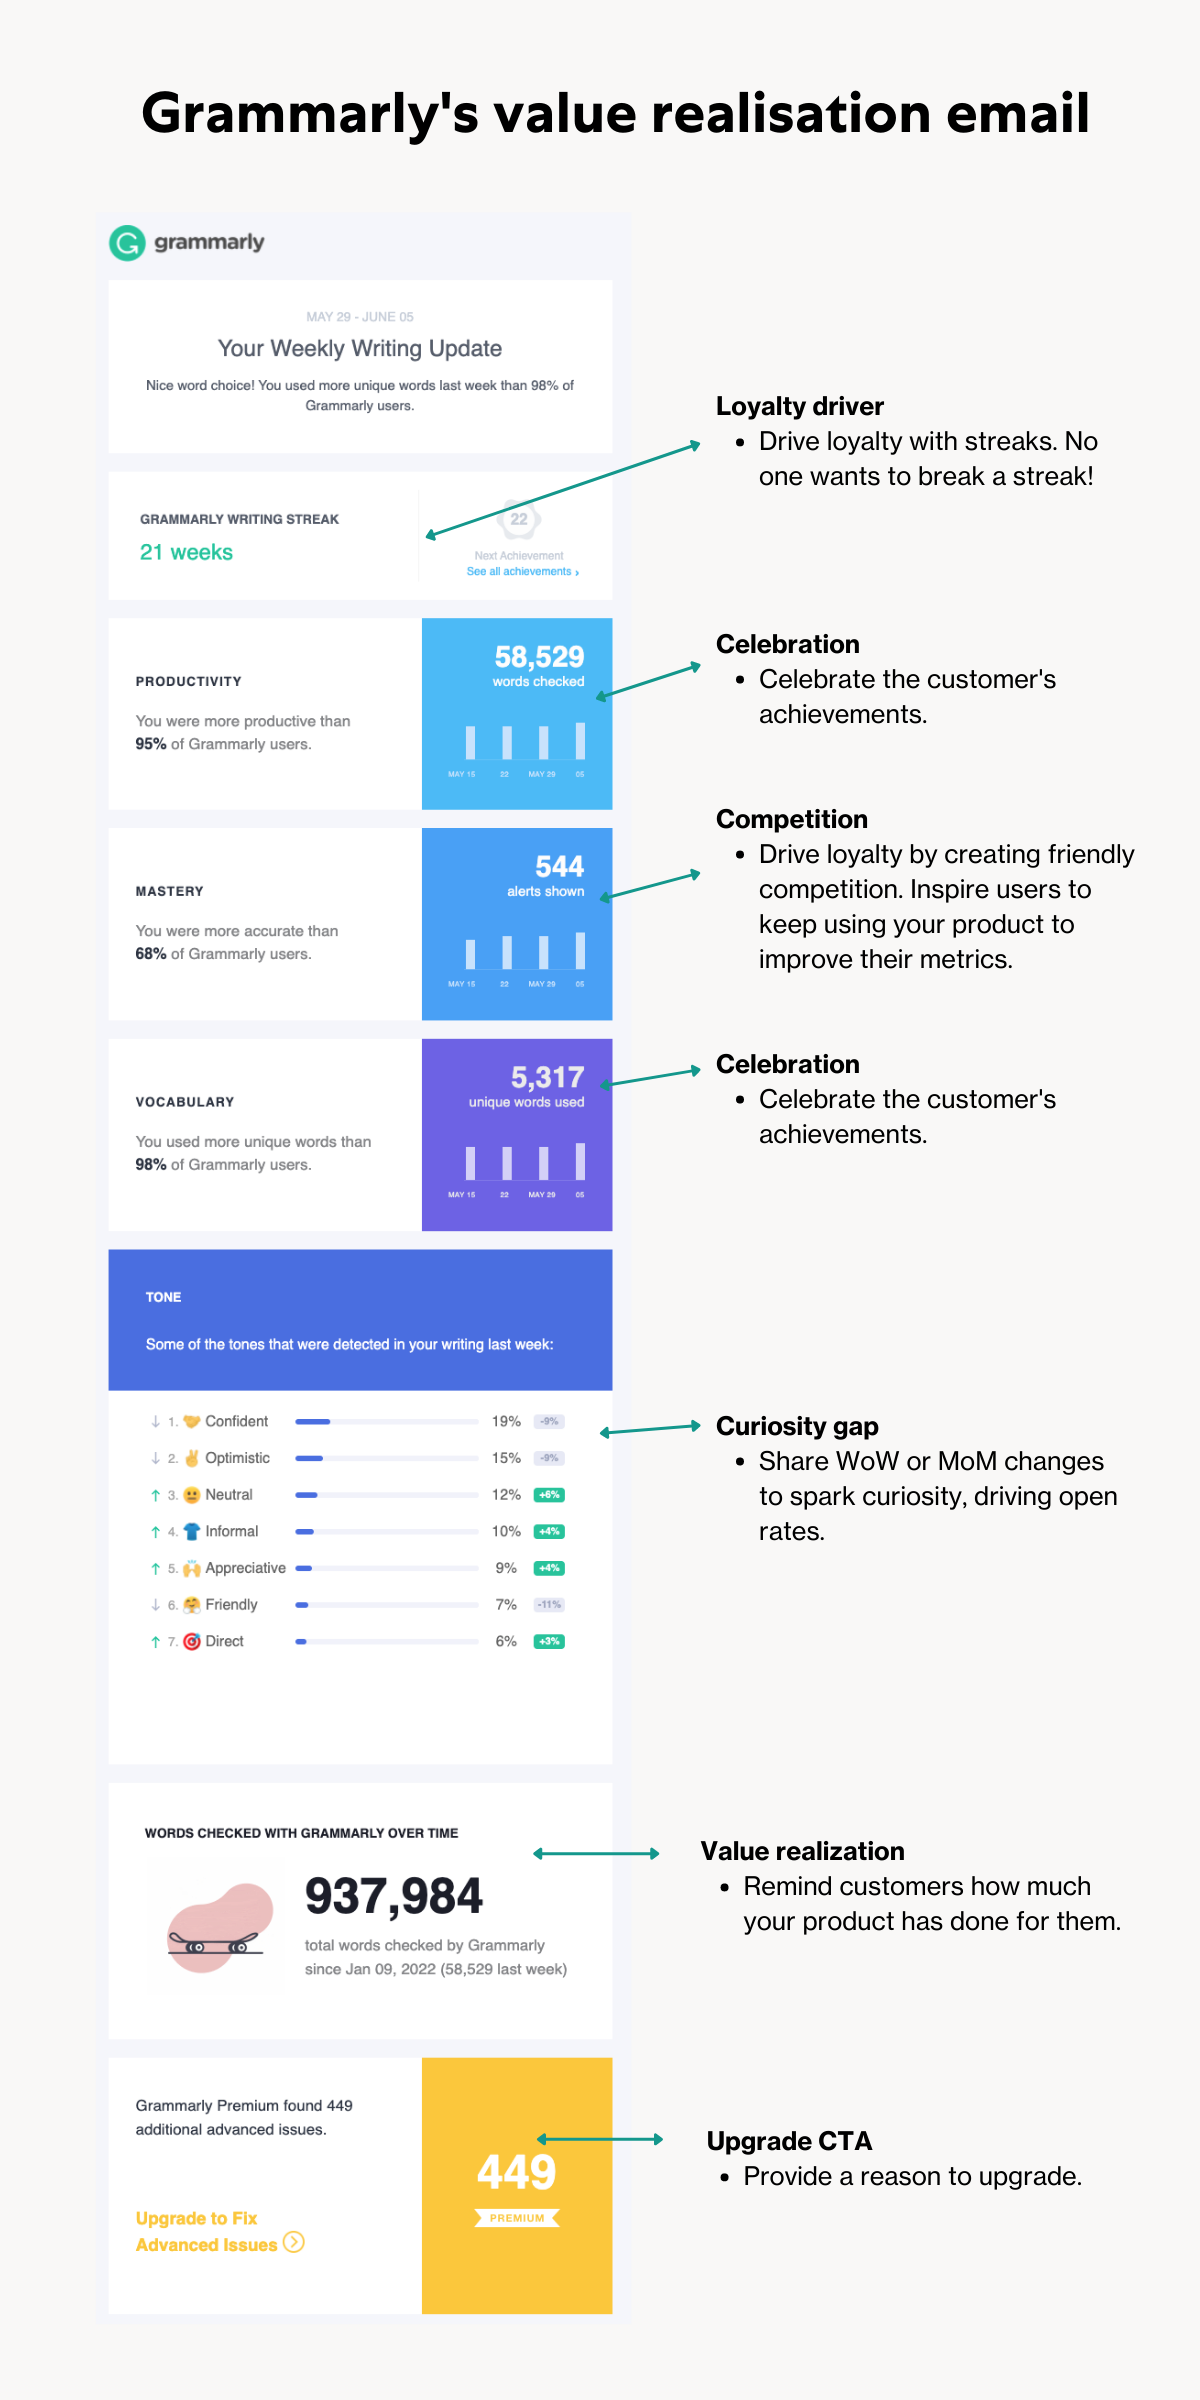
Consider how your product could create something similar at key moments throughout the customer’s lifecycle. Maybe they’ve been with you for three months and you want to show them how much time they’ve saved or revenue they’ve generated. Or perhaps it’s week one and they’ve already integrated their tech stack and set up their first project.
Whatever set of stats you choose, the goal is to appeal to all of the things that make us want to keep up a good habit.
8. Share brand updates
Keeping engagement high doesn’t stop with in-product use, it’s important that your customers are engaging with your brand, too.
Blogs, newsletters, product updates, and social content provide extra value to your customers and inspire them to keep growing with you. Focus on adding real value through content that provides examples, explainers, and how-tos to keep customers coming back.
When your customer feels truly connected to your brand, they’ll be less likely to churn. Plus, with a regular feed of inspiration and how-tos, they’ll be motivated to log in and discover new or new-to-them features and use cases. It’s all about the long-term, doing little things to help keep the excitement alive long after their initial ‘aha’ moment.
9. Identify at-risk customers with NPS surveys
Tracking your Net Promoter Score (NPS) helps you to identify the customers who may be at risk of churning and will provide a steady stream of feedback that can inform product improvements and updates.
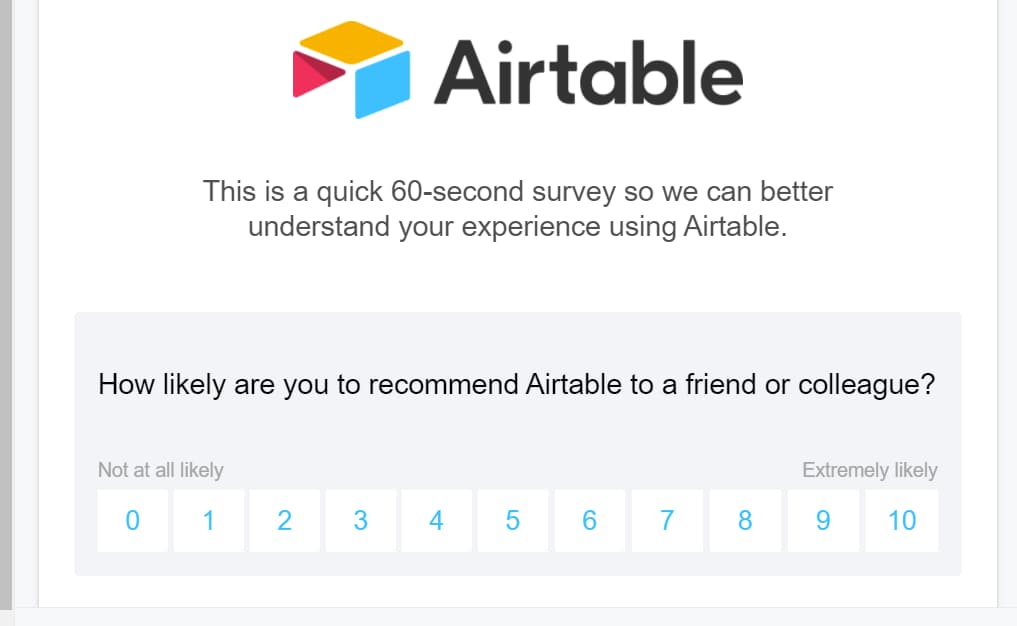
Use an automated NPS follow-up journey to detractor's a follow-up question so your support team can reach out and help resolve issues, and generate improvement areas.
In the example below, you’ll see how Evernote uses a progressive NPS to evaluate performance on a macro level and home in on specific features. The use of progressive disclosure — showing one screen with one question, before asking the customer for more information — helps ensure that customers are not put off by the granular level of feedback they are being asked to provide.
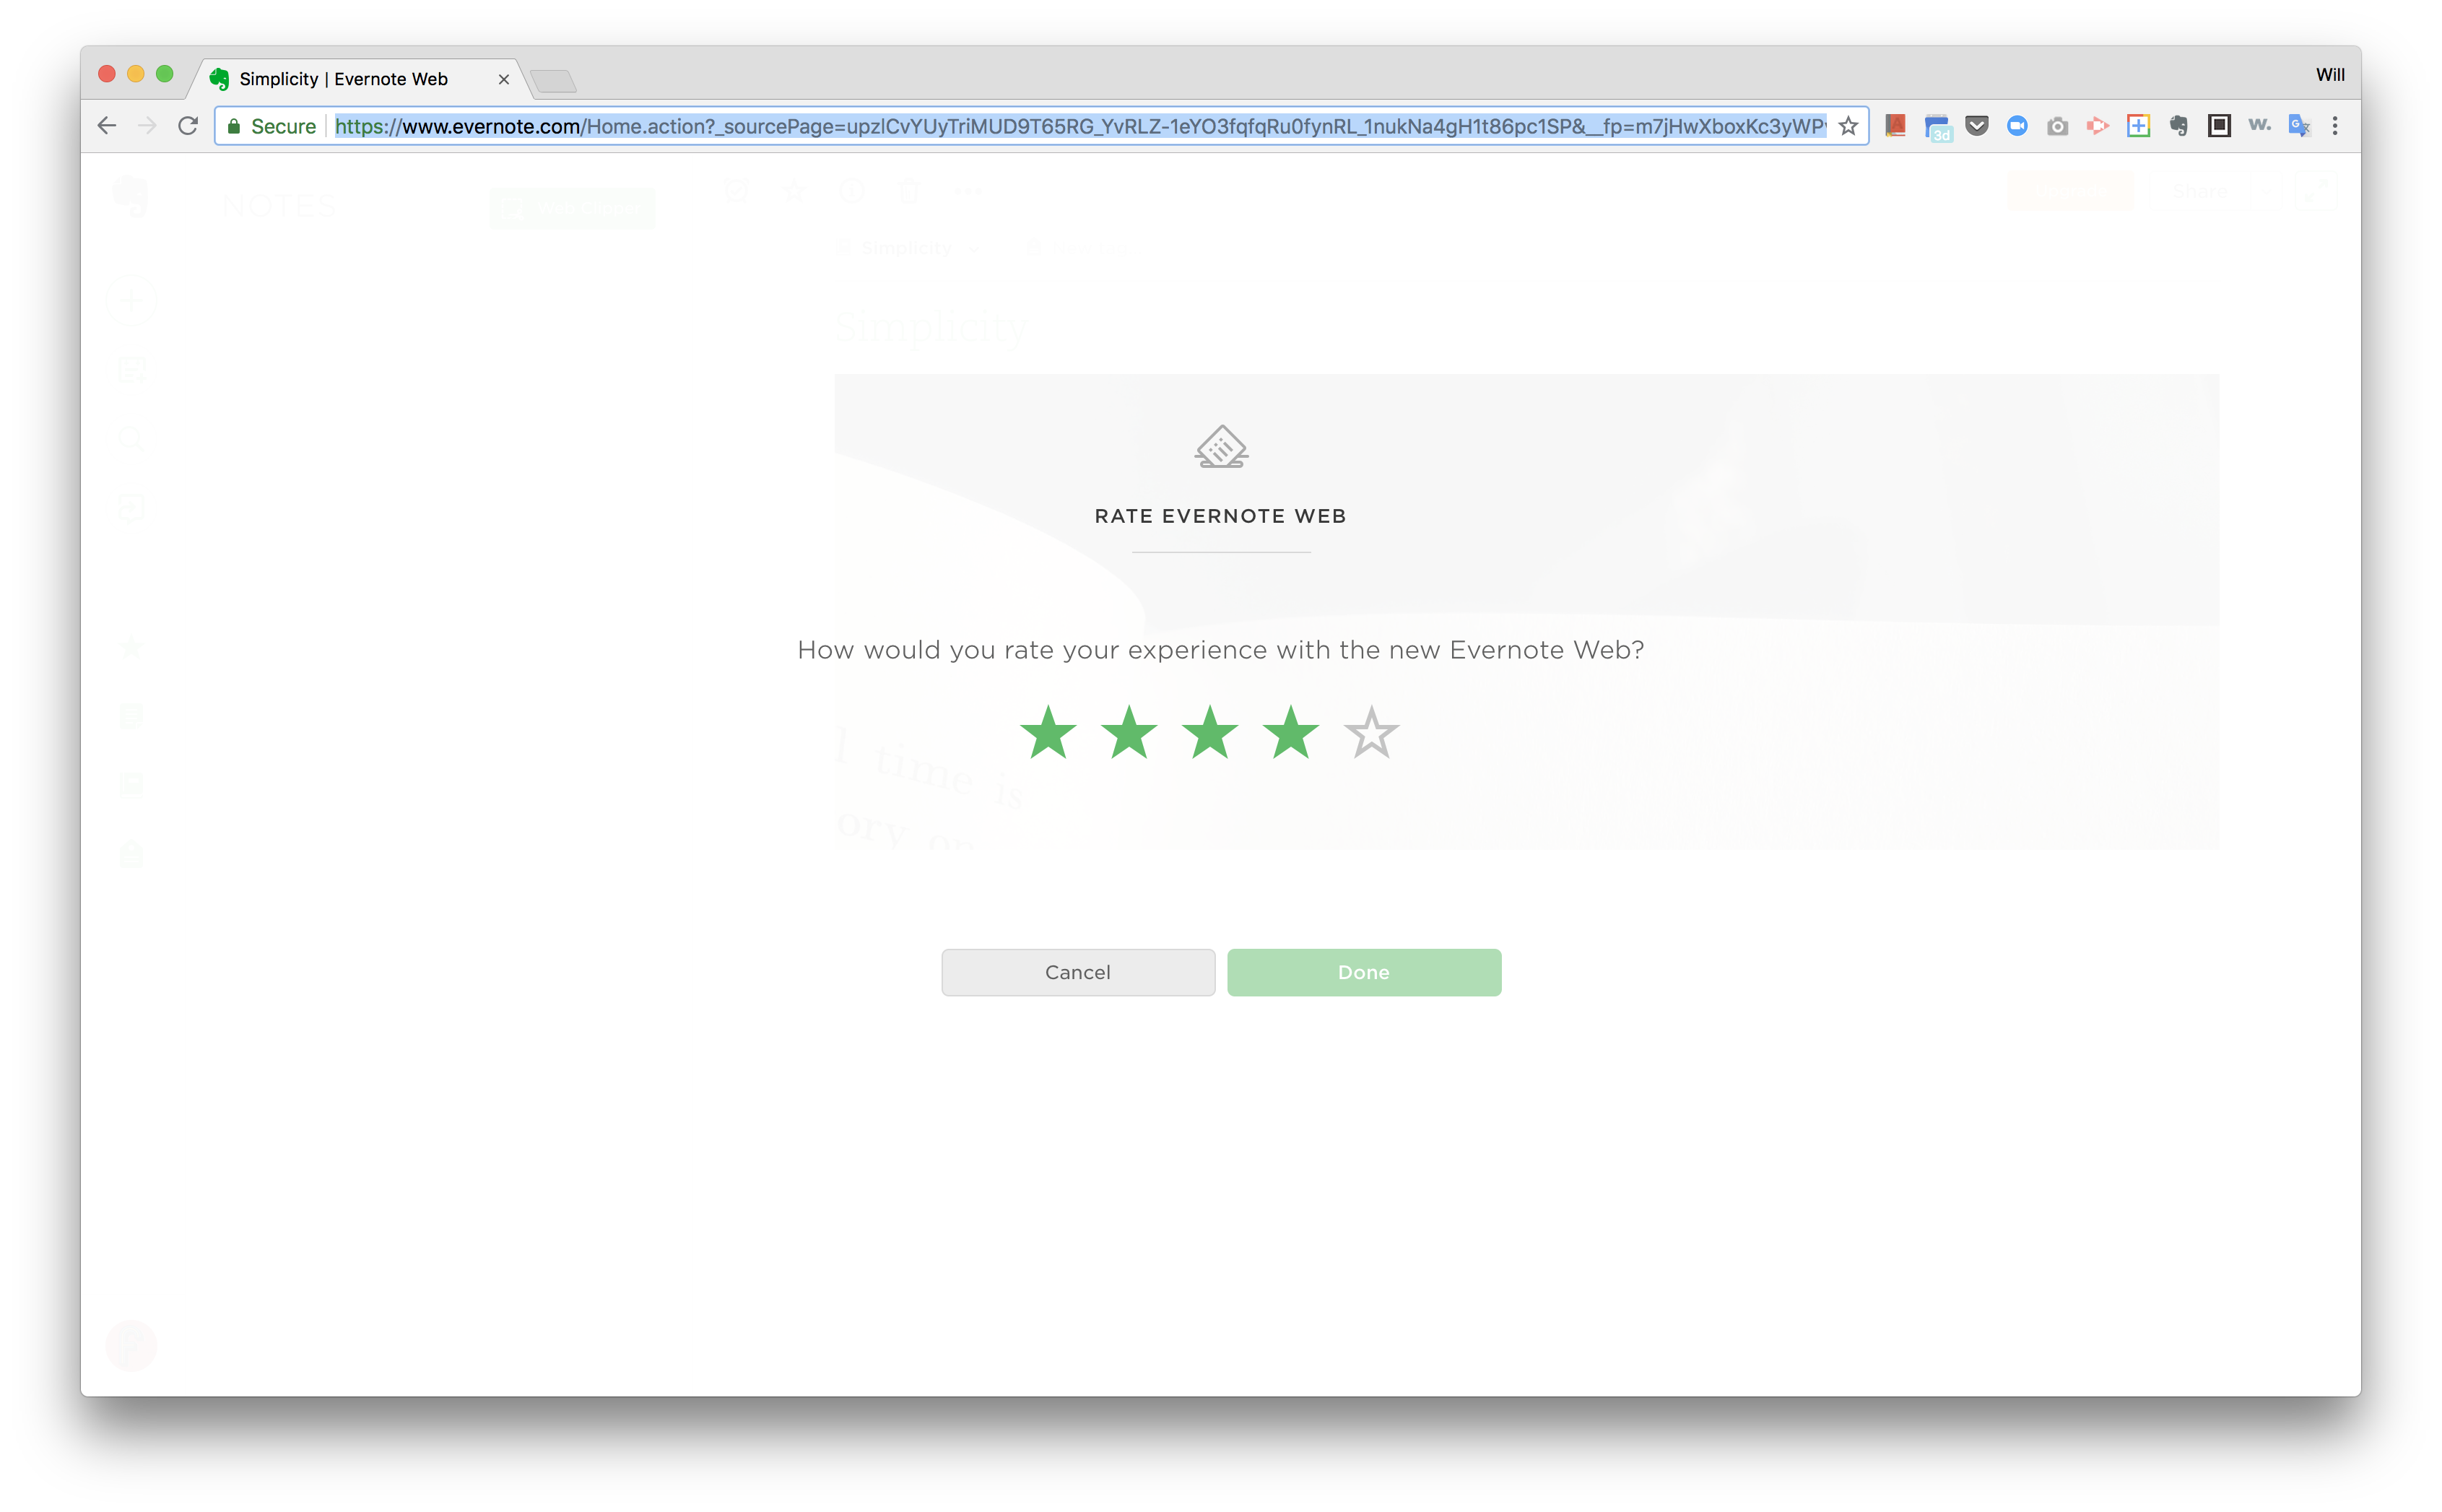
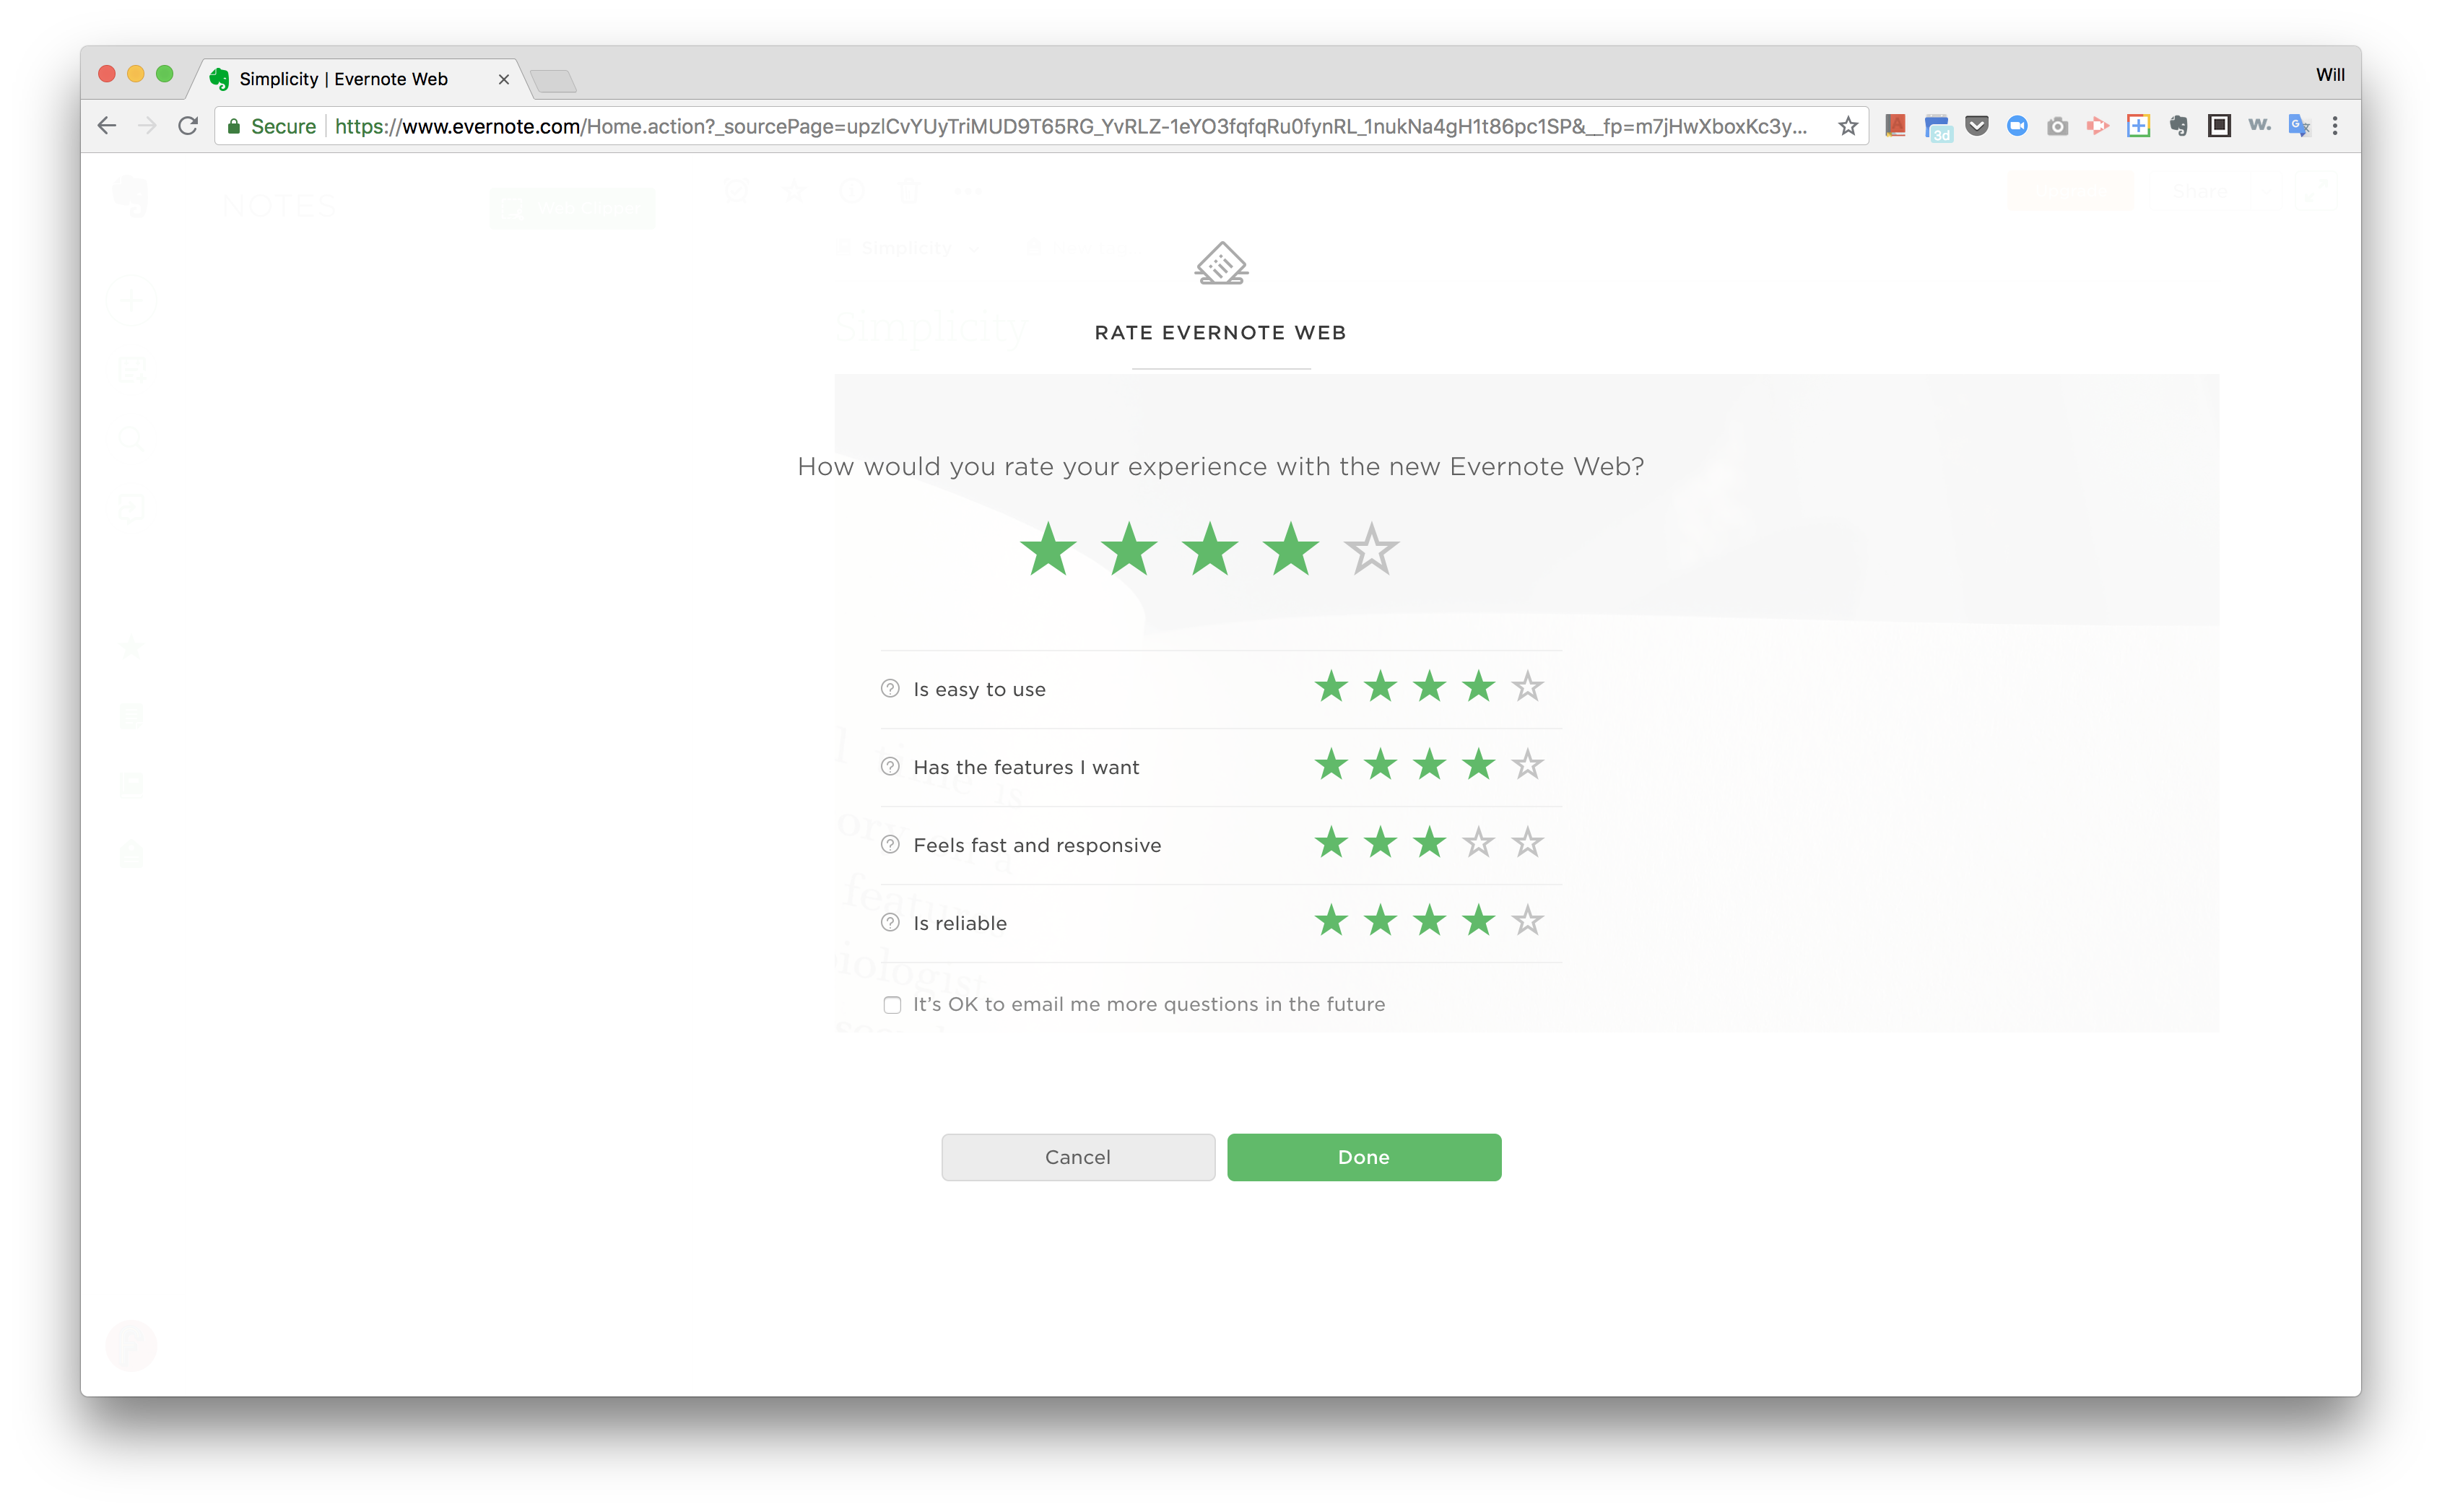
Image source: Reallygoodux.io
10. Focus on your most profitable customers
Don't neglect the customers who are less likely to churn! When you focus on providing an exceptional experience to customers who are more likely to bring in high ARR, you can proactively prevent churn in the customers who have an outsized impact on your business's overall health.
As Harvard Business School Professor Sunil Gupta shares in his paper Managing Churn to Maximize Profits, focusing on higher-spending customers, even if they aren’t as likely to leave, can increase the total profit a company can reap. In an experiment conducted for the paper, Gupta applied a new algorithm to manage churn — one that identified: the high-spending customers who were likely to churn (even if that likelihood was lower), and filtered for the customers that were more likely to respond to a retention offer. With this information, they were able to theoretically increase profits by 180 percent.
11. Keep your competitors close
Watching what your closest competitors are doing can help you identify churn before it happens. For example, if a close competitor with a lower barrier to entry (price or product difficulty) launches a new feature that is a copycat of your top-performing feature, it’s likely they’ll be coming for your customers via targeted advertising or sales outreach.
Now is not the time to panic, but it is worth being aware of any market changes that could impact your customer’s decisions. Show your customers, especially those who you have identified were already at-risk to churn, a little love and remind them why they chose your product in the first place.
12. Build a community
Some of the top-performing SaaS brands today, like Figma, Notion, and Asana, have the strongest communities. This is not a coincidence. Customers are more loyal to brands when they feel that being part of the product makes them part of something bigger.
We have a whole article on taking a community-led approach to growth with plenty of examples to learn from. One of the most important things to learn from these success stories is that it’s not so much about forcing your customers to become a community, it’s about identifying the community that is already out there and giving them the resources they need to thrive.
The final word
Churn is inevitable, and there is a certain level of churn that your business will come to accept. The goal is to avoid exceeding that level of acceptable churn, so your business can continue to grow.

Try Ortto today
Build a better journey.
Product
Pricing
Solutions
Features
About
Resources

